
Chapter 1: The Year in Review
Economic Review of the Recovery Act
What We Were Facing
Enacted on February 17, 2009, the American Recovery and Reinvestment Act (“ARRA” or “the Recovery Act”) was designed to combat the largest downturn in the economy since the Great Depression and to help put Americans back to work. One year later, we can definitively say that ARRA is meeting its goals and providing a measureable benefit to the economy. When ARRA was passed, the economy was in freefall. Job numbers were plummeting and unemployment rolls were expanding. More and more Americans were losing their jobs and the country was in need of a jumpstart. ARRA has provided just that.
The Recovery Act Has Had an Effect
As ARRA funds have begun to work their way through the economy, several key indicators show that they have clearly halted an economic freefall. In their recently released quarterly report, the Council of Economic Advisers (CEA) found that GDP had been positively impacted by ARRA:
“ARRA added between 2 to 3 percentage points to real GDP growth in the second quarter of 2009; between 3 and 4 percentage points in the third quarter, and between 1.5 and 3 percentage points in the fourth quarter. This is broadly similar to those of a wide range of other analysts.”1
Figure 1 shows the progression of GDP over the past five quarters.
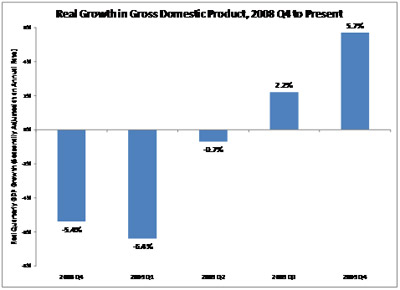
Figure 1 GDP Progression over the Past Five Quarters
GDP is not the only indicator that shows a boost from ARRA funds. Payroll job losses are also lessening and, ever since a peak in March of 2009, unemployment insurance claims have been generally declining. Both these trends can be seen in Figures 2 and 3:
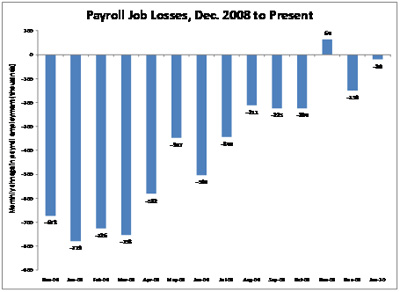
Figure 2 Payroll Job Losses December 2008 – Present2
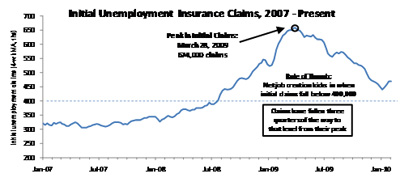
Figure 3 Initial Unemployment Insurance Claims, 2007 - Present3
It is no accident that we have seen the labor market improve dramatically since the passage of ARRA – abundant evidence and many different experts say it is creating millions of jobs.
The Recovery Act Has Created Jobs
At the end of September 2009, CEA released their first quarterly report, finding that ARRA had created or saved over 1 million jobs. In their second quarterly report, CEA found that this positive trend continues, with ARRA having created or saved 1.5 to 2 million jobs in the fourth quarter of 2009, as shown in Figure 4. The Congressional Budget Office (CBO), in their latest report on the status of ARRA implementation, also found that ARRA funding has supported a comparable number of jobs – with their estimate being up to 2.4 million jobs supported.
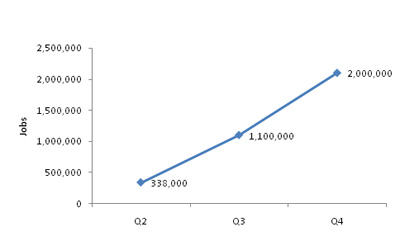
Figure 4 Recovery Act Jobs Created or Saved by Quarter, per CEA4
These jobs not only span sectors, but also span the entire country as is seen in Figure 5.
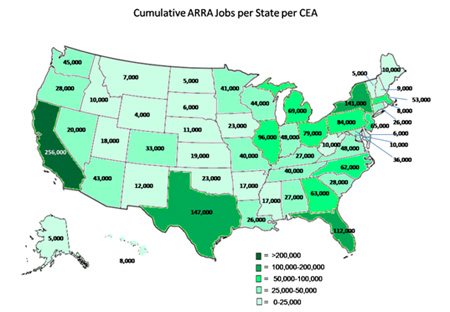
Figure 5 Cumulative ARRA Jobs Created or Saved by State per CEA5
Implementation Review of the Recovery Act
Total Obligations and Outlays
A primary goal of the Act was to get money into the economy in a rapid and responsible manner. Spending was intended to move out quickly but its primary impact was designed to be felt over a roughly a two year period. As of the end of January, the Recovery Act has obligated a total of $334 billion in spending, outlayed $179 billion of that amount, and provided an estimated $119 billion in tax relief for families across the country. Thus, $453 billion, or 57 percent of the $787 billion total, as estimated at enactment, has been put to work in the economy, providing immediate rescue for those suffering the most, rebuilding our nation’s infrastructure, building industries of the future, and providing much needed tax relief including cuts for 95 percent of working families.
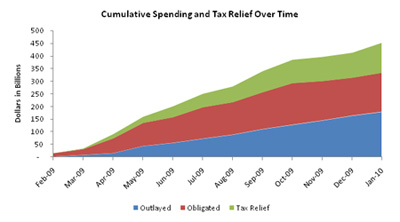
Figure 6 Cumulative Spending and Tax Relief over Time6
The Structure of the Recovery Act
Notwithstanding this progress, the nature of the Recovery Act remains misunderstood by many, and misconstrued by others: critics have suggested that the entire $787 billion is being spent on earmarked programs. Instead, the Recovery Act is divided into three roughly equal parts: tax relief, direct aid to states and individuals (or “payments”), and projects that not only help rebuild today’s infrastructure, but also invest in the industries of tomorrow. And it has no earmarks.
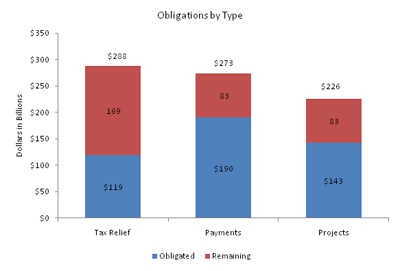
Figure 7 Three Major Categories of Spend and Where They Are as of the End of January, 20107
Spending at Different Paces
The Recovery Act is a balanced package that anticipated a multi-year recovery. By design, it includes some investments that spent out immediately, and others that kick in later so that the stimulating affects of the Act support a more sustained recovery. The single largest part of the Recovery Act — more than one-third of it — is tax cuts: 95 percent of working Americans have seen their taxes go down as a result of the Act, the broadest tax cut in history. This was designed to provide gradual and sustained tax relief to families over a period of time. And it kicked in right away.
The second largest part of the Act — just under a third — is direct relief to state governments and individuals. The money is allowing state governments to pay teachers (hundreds of thousands across the country according to reports filed from state governments), firefighters and police officers and is also preventing states’ budget gaps from growing wider. And those hardest hit by the recession are getting extended unemployment insurance, health coverage, and other help to get through these tough times. This money goes to state governments and families in need, without red tape or delays, and was designed to be the quickest acting mechanism to save our economy from the brink of a second Great Depression. For this reason, over 80 percent of the outlays in the spending categories of the Recovery Act in 2009 came in the form of payments that did exactly this. And without these payments, those hurting the most in our country would have found themselves in even greater need, and our economy would have suffered much greater damage.
The final third of the Act comes in the form of projects. These projects are not only comprised of the critical work that needs to be done to rebuild our country today, but also the work that needs to be done to lay the foundation for a stronger economy – one that will position America to compete for the jobs and in the industries of tomorrow. Investments in new technologies such as high speed rail, health information technology, and the clean energy economy were designed to start spending out later in the Act and to last longer, providing an infusion of funds to keep the recovery on track. And here too, much progress has been made. In fact, while many doubted the speed at which such funds could be put to work, the federal agencies in charge of implementing these programs instead just worked harder and organized around the goal to make sure those doubts did not become reality. And the results are clear: in fact, despite this being the smallest of the three parts of the Recovery Act, just about a third of money currently at work (obligations + taxes) is coming from project related activity. Moreover, the majority of project funds are already obligated. This means that economic activity is already underway as states and localities hire contractors, companies hire workers, and work gets started. And much more project work is still to come.
As shown in Figure 7 above, even with these different spend out rates, all three categories have committed funds at work in the economy.
It is also important to note that, of the $166 billion in funds remaining to be obligated, almost every dollar has already been spoken for, even if not yet obligated. Many of the ‘payment’ types of funds, such as Medicaid, are allocated on a quarterly basis, and are not obligated until the start of each quarter. Of the project related funds, many, such as High Speed Rail and smart grid funds, have already been awarded to recipients but have yet to be obligated. In addition, approximately $20 billion in unobligated funding is related to Health IT investments some of which will be awarded later this year, and the rest of which will be spent in the form of incentive payments starting in 2011 for providers who adopt Health IT.
Ahead of Anticipated Pace
Though each part of the Act was designed to spend at different rates, the Act overall represents one of the largest and fastest infusions of direct funding into the economy. Just as the Congress understood the urgency of passing the Recovery Act, so too did the Federal agencies and their partners in charge of implementing it. In fact, Recovery Act funds have not only moved into the economy quickly, but the pace has also exceeded the Congressional Budget Office’s (CBO) original ambitious projection, as shown in Figure 8.
Part of keeping up the pace of moving funds out into the economy is tied directly to the oversight and management capabilities of the Federal agencies. Agencies have worked diligently to move funds out the door as fast as possible, while not sacrificing the careful selection processes, monitoring, and oversight necessary to make sure that Recovery Act funds are being used in a prudent manner. Understanding that speed in getting funds into the economy is crucial to achieving the goals of the Act, agencies, such as the Department of Defense, have reallocated funds from projects that, while worthy, are not able to execute in a timely fashion. In other cases, agencies have realized bid savings on project costs – and have quickly reallocated those “excess” funds to new projects, allowing more projects to be started than originally projected. For example, in August, the Department of Homeland Security was able to quickly reallocate $240 million in bid savings on current projects to new in-line baggage screening projects at ten additional airports across the country.8
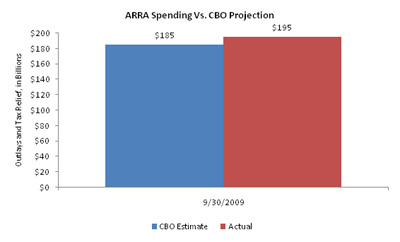
Figure 8 Recovery Act Spending vs. CBO Spending Projection as of September 30, 20099
It is important to note that ARRA funds are not only going out ahead of schedule, but also with unprecedented transparency. The last recipient reporting period, covering work through December 2009, exhibited over 160,000 reports from those recipients required to submit reports on ARRA funds. Those 160,000 reports were reviewed and made public on deadlines that are faster than any other major financial reporting activities would require.10
What We’ve Done So Far
Funds across the three major categories of spending –Rescue, Recovery, and Reinvestment – are moving out into the economy, as can be seen in Figure 9 below.
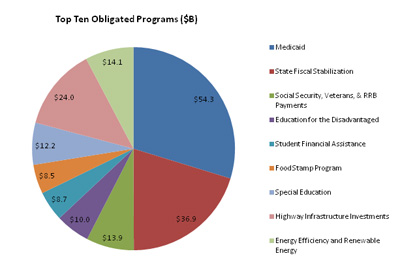
Figure 9 Top Ten Obligated Programs as of the end of January, 201011
At of the end of January, the majority of funds that have been disbursed into the economy were those providing Rescue and Relief to Americans, including the estimated $119 billion dollars in tax relief provided as of the end of January. In addition to tax relief, $190 billion in obligations and $145 billion in outlays (over 80 percent of all outlays) had gone towards direct support of individuals, states and cities, supporting programs such as:
- Unemployment Insurance – both the extension of benefits up to 79 weeks as well as an increase in the amount of payments (these have since been expanded and extended by further legislation);
- Medicaid – allowing states to maintain benefits and support increasing numbers of people requiring medical care;
- State Fiscal Stabilization funds – providing much needed funds for state governments to use to support both education as well as other government services;
A distribution of the obligations associated with these payments can be seen in the following chart.
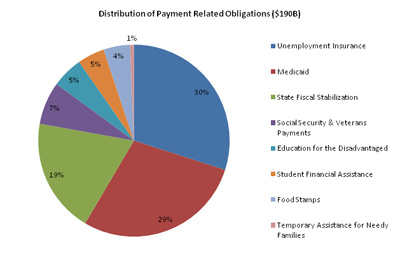
Figure 10 Distribution of Obligations Associated with Payments in the Recovery Act, as of the end of January, 201012
The remaining funds that are those supporting projects, such as investments in highways, airports, water projects, housing and other infrastructure projects, as well as projects in green energy programs and other programs that help build industries of tomorrow. In total, over $140 billion has been obligated to project related activities. As shown in Figure 11 below, these funds span a wide array of programs and, as such, are more fragmented than are the funds that go towards “payments.”
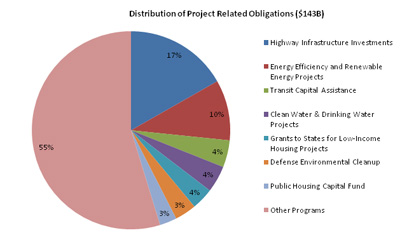
Figure 11 Distribution of Obligations Associated with Projects in the Recovery Act as of the end of January, 201013
And areas such as HHS’s Health IT program, DOE’s smart grid or loan guarantee programs, Commerce’s and USDA’s broadband programs, or DOT’s high speed rail program have all started or finished awarding their funds, have all started obligating their funds, and will all play a bigger role in recovery in the year ahead.
With over $453 billion obligated, or almost 60 percent of the Recovery Act at work in the economy today, the stories that speak to those funds’ effects and the yardsticks that measure the funds’ impact abound. Since the Recovery Act’s passage a year ago, we have:
- Cut taxes for 95 percent of working families through the Making Work Pay tax Credit – that’s $37 billion in tax relief for 110 million working families in 2009.
- Made loans to over 42,000 small businesses, providing them with nearly $20 billion in much-needed capital
- Funded over 12,500 transportation construction projects nationwide, ranging from highway construction to airport improvement projects.
- Funded projects at 51 Superfund sites from the National Priority List. Of those sites, 34 already have on-site construction.
- Started more than 2,850 construction and improvement projects at over 350 military facilities nationwide, with more than 950 projects completed.
- Made multi-billion dollar investments in innovation, science and technology that are laying the foundation for our 21st century economy including:
- $2.4 billion in grants to companies and educational institutions in over 20 states to fund 48 new advanced battery and electric drive projects that will help power the next generation of advanced vehicles.
- $3.4 billion in grants to private companies, utilities, manufacturers and cities to fund smart energy grid projects that will support tens of thousands of jobs and benefit consumers in 49 states.
- The first of over $7 billion in awards to bring broadband to communities where there is little or no access – a significant step forward in driving local economic development.
- More than $5 billion in grants to fund 12,000 cutting-edge medical research projects at research and educational institutions in every state across the country.
- $8 billion in awards to fund projects in 31 states that lay a foundation for a high speed rail network here in the U.S. – a move that will not only create jobs and drive economic growth, but jump-start a critical element of our 21st century infrastructure.
- Provided critical relief for state governments facing record budget shortfalls, including:
- More than $50 billion to help prevent cuts to Medicaid programs across the country.
- Nearly $60 billion in funding for education – a move that governors say is already responsible for creating and saving over 300,000 education jobs in the fourth quarter of 2009.
But we will not be satisfied until every dollar is at work, aiding Americans hurt and out of work, helping Americans who want a job find a job, and building the economy of tomorrow.
Progress toward Our Goals
Looking forward, we have a clear goal to disburse (outlays + taxes) 70 percent of Recovery Act funds, or $551 billion, by September 30, 2010. We are on track to achieve this goal.
We have disbursed to date nearly $300 billion in outlays and taxes for an average monthly rate of about $27 billion. Of that $27 billion, $11 billion has been in the form of tax relief and $16 billion in spending.
To achieve our goal for a $551 billion in disbursements by the end of September, we will need to disburse $32 billion per month going forward, a pace which we will meet or exceed. From February onwards, monthly tax relief should increase from $11 billion to $18 billion. Though the mix in type of outlays will change significantly going forward, as discussed later in this report, the rate of outlays will not see a drastic change given the continued focus on turning obligations into outlays and the increase in tax relief that we expect. Nevertheless, we expect to see a flat to modest increase in the pace of outlays which will further ensure that we meet our September 30, 2010 disbursement target.
Vice President Biden has directed all agencies to submit regular obligation and outlay updates, and has made clear to all agencies that these forecasts are the basis of meeting the Administration’s goal of getting money into the economy quickly. These forecasts are being tracked rigorously and deviations will be addressed immediately.
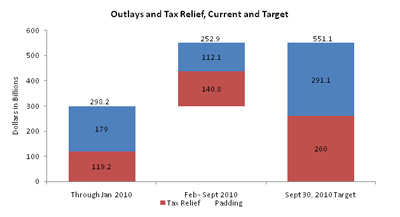
Figure 12 Outlays and Tax Relief, Current and Target14
Mix of Outlays Changes in 2010, With Projects Spending Accounting for a Larger Share
Just as tax relief will play a major part in 2010 disbursements, so will spending, as outlays comprise the second and critical part to meeting the goal of disbursing 70 percent of the Act by September 30. In the months ahead, there will be a modest uptick in the monthly outlay rate of the Act. More importantly however, the mix in spending will shift significantly from being primarily payment driven to being more evenly matched between payments and projects. In fact, monthly project outlays are expected to more than double compared to the 2009 average. Since payments were the portion of the Act most quickly disbursed in 2009 to rescue the economy from freefall, 2010 payment outlays may see a slight drop off in pace. Nevertheless, total monthly outlays will see a modest uptick which will be driven by projects.
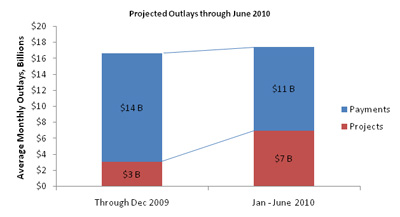
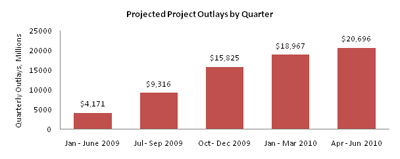
Figures 13 and 14 Projected Outlays through June 201015
Building on the Successes of the First Year
The increase expected in overall outlay pace going forward, as well as in the change in mix, can be directly traced to a groundwork that was laid in the first year of the Act’s implementation. Through the end of January, a total of $334 billion in spending had been obligated, of which $179 billion had been outlayed. The portion of obligations made up by payments was greater than the portion made up by projects, but by less than 15 percent. However, the split within the portion outlayed is dramatically different, with over four times as much going towards payments v. projects. In other words, less than one fifth of outlays through January were project related outlays. Thus, project related dollars that are already obligated and working in today’s economy will transition into significant corresponding outlays. By the numbers, in addition to the money that is left to be obligated, there remains $112 billion in obligated project dollars that have yet to be outlayed, while by contrast, there remains only $43 billion in obligated payment dollars that have yet to be outlayed.
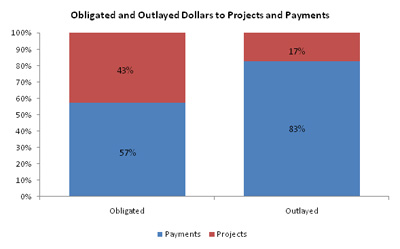
Figure 15 Obligated and Outlayed Dollars to Projects and Payments, February 2009 through January 201016
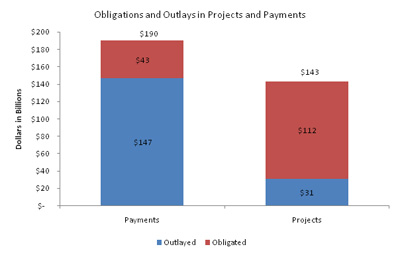
Figure 16 Obligations and Outlays in Projects and Payments, February 2009 through January 201017
Therefore, fueled largely by a strong first year performance of getting dollars awarded and projects obligated and started, the year ahead will see a capitalizing on an inventory of work that is awarded and “ready to go”. This capitalizing explains much of the increase in outlay pace as well as the change in outlay mix that will be seen in the months ahead.
Further evidence of this lies in reports filed by a portion of Recovery Act funding recipients who, by law, report on the use of their funds every quarter. These recipients filed reports in January detailing the status and progress made on their awards through December 31, 2009. Despite the sizeable activity that these recipients depict, their reports tell us that the vast majority of their projects are less than half complete. This assessment remains the same whether made in terms of project numbers or in terms of dollars as is seen in Figure 17.
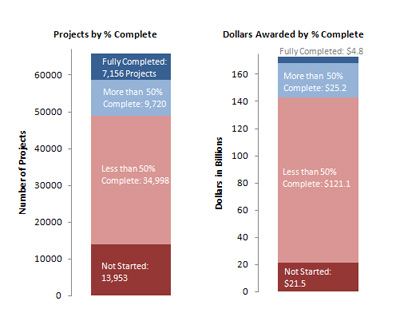
Figure 17 Projects and Dollars by Level of Completeness18
With a strong and increasing base of awards that have been made, and with large numbers of awards that still have more than half of their work remaining to be done, the level of on-the-ground work being done by the Recovery Act will remain strong and the pace of outlays will accelerate during Fiscal Year 2010.
Signature Projects Come Online
In addition to the increase from standard infrastructure related projects, 2010 will also see work getting underway on several of the longer-term signature investments in the Recovery Act, including the recently awarded High Speed Rail, Health IT and Broadband related grants. The table below provides some highlights on signature programs – part of the Reinvestment phase of ARRA – that are scheduled to spend out over 2010 and beyond, keeping the Recovery moving forward.
| Agency | Program | Cost | Awarded? | Still to Obligate | Still to Outlay | Notes |
| HHS | Health IT | $20B | In process | $19B | $20B | Extension centers and state grants just awarded their first batches of funds, with more to come. Beacon communities and remaining upfront portions of spend will commence awarding in the months ahead, while the remaining $20B+ in incentive payments for adopting Health IT will start in 2011. |
| HHS | NIH grants | $10B | In process | ~$5B | ~$9B | Outlays will be steadily drawn down over 2010 and 2011, with a surge in August and September when multiyear research grants and contracts receive their second year of funding |
| DOE | Smart Grid | $4.5B | Completed | $1.6B | $4.5B | Awards were made in October and, as the funds are placed under contract, awardees will start expanding operations and hiring |
| DOE | 1705 Loan Guarantees | $4B | In process | $3.9B | $4.0B | As loans move from the conditional offer to the contract closing phases, companies will expand and create jobs |
| DOE | Weatherization | $5B | Completed | $0.2B | $4.5B | Most states have recently finished establishing and training a workforce, and nationwide units weatherized should number in the 10s of 1000s per month going forward |
| DOT | High Speed Rail | $8B | Completed | $8B | $8B | Rail corridor awards were announced on January 28th. Now that all awards have been announced, funds will be obligated and drawn down over time. |
| DOC/ USDA | Broadband | $7.2B | In process | ~$6.9B | ~$7.2B | First awards were announced in December and January. Rolling announcements are underway and the program expects to be fully awarded by Sept. 2010. |
| ED | Race to the Top | $4.3B | Not started yet | $4.3B | $4.3B | Applications have been received in January. Awards are expected in the spring. |
Figure 18 Signature ARRA Project Status19
1CEA: “The Economic Impact of the American Recovery and Reinvestment Act of 2009 Second Quarterly Report” http://obamawhitehouse.archives.gov/sites/default/files/microsites/100113-economic-impact-arra-second-quarterly-report.pdf
2Source: Department of Labor, Employment and Training Administration
3 Source: Department of Labor, Employment and Training Administration
4 CEA: “The Economic Impact of the American Recovery and Reinvestment Act of 2009 Second Quarterly Report” http://obamawhitehouse.archives.gov/sites/default/files/microsites/100113-economic-impact-arra-second-quarterly-report.pdf
5 CEA: “The Economic Impact of the American Recovery and Reinvestment Act of 2009 Second Quarterly Report” http://obamawhitehouse.archives.gov/sites/default/files/microsites/100113-economic-impact-arra-second-quarterly-report.pdf
6 Financial and Weekly Reports from agencies; Office of Tax Analysis tax estimates
7 Financial and Activity Weekly reports as of 1/29/10, Office of Tax Analysis tax estimates
8 http://www.dhs.gov/ynews/releases/pr_1251299226398.shtm
9 CBO; Financial and Activity Reports as of 9/30/09
10Financial reports such as the Non-profit IRS 990, Private Sector Year-End SEC 10K, and the Private Sector Quarterly SEC 10Q, and the deadlines for federal agency financial statements
11Financial and Activity Report as of 1/29/10
12Financial and Activity Report as of 1/29/10
13Financial and Activity Report as of 1/29/10
14Data from 02/12/2010. Tax dollars data from the Office of Tax Analysis estimates.
15Data as of 1/29/10; quarters based on calendar year. Projections have been calibrated to match actual outlays. Source: Agency spending projections; administration estimates
16 Financial and Activty Weekly reports from agencies
17 Financial and Activty Weekly reports from agencies
18Second Quarter Prime Recipient Reports as posted on Recovery.gov on Feb 10, 2009
THE RECOVERY BILL
The American Recovery and Reinvestment Act is a strategic and significant investment in our country’s future. The Act will save and create jobs immediately while also laying the foundation for a robust and sustainable 21st century economy by modernizing our health care, improving our schools, modernizing our infrastructure, and investing in the clean energy technologies of the future.
![]()
RECOVERY STORIES
What does recovery look like in your community? Share your photos, videos or stories about recovery projects happening in your area and show us how the Recovery Act is impacting your community.

![]()