Recovery Act Third Quarterly Report - Progress of Spending and Tax Reductions
THE PROGRESS OF SPENDING AND TAX REDUCTIONS UNDER THE RECOVERY ACT
The first step in evaluating the effects of the Recovery Act is to analyze the data on spending and tax reductions that have occurred under the Act. It is certainly possible that the Act could have effects even if no tax changes or spending had yet occurred. For example, its passage could have affected confidence, and expectations of a tax cut in the future could affect household spending today. But, it is likely that the Act’s most significant impact has been from funds that have actually been spent and tax cuts that have actually reached consumers.
Overall Budgetary Impact
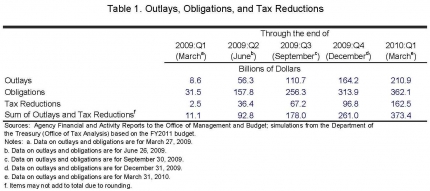
Data on the overall budgetary impact of the Recovery Act are available on the Recovery.gov website. The data are broken down into outlays, obligations, and tax reductions. The outlays and obligations by agency are available weekly and the tax reduction data are available quarterly.1 Outlays represent payments made by the government. Those funds represent spending that has already occurred. Obligations represent funds that have been made available but not necessarily outlayed, such as for a highway project where the builder must complete the work properly to be fully reimbursed by the Federal government. In many instances, obligations can generate economic activity because recipients may begin spending as soon as they are certain funds are available.
Table 1 shows outlays, obligations, and tax reductions as of the end of each quarter since the Act’s passage (March 2009, June 2009, September 2009, December 2009, and March 2010). As of the end of the first quarter of 2010, the sum of outlays and tax cuts was $373 billion, with an additional $151 billion obligated but not yet outlayed. This is similar to the amount projected to have been spent by this point by the Congressional Budget Office (CBO) when the Recovery Act was passed.2 Additionally, the sum of spending, obligations in excess of spending, and tax cuts is $525 billion.

Components of the Recovery Act
The categorization of stimulus into outlays versus tax reductions follows accounting conventions, but in a broader sense is somewhat arbitrary. For example, the Making Work Pay tax credit, which reduced taxes for 95 percent of working families, is treated as a tax cut, while the $250 extra payment to seniors and veterans is treated as an outlay. Yet, both are thought to affect economic activity by putting more money into the hands of consumers. For this reason, it is useful to consider a more functional decomposition. The decomposition is not only interesting in its own right, but is necessary for our later model-based analysis of the impact of the program.
We divide the total dollars of stimulus expended to date into six categories: individual tax cuts and similar payments; the tax cut associated with the adjustment of the Alternative Minimum Tax (AMT); business tax incentives; state fiscal relief; aid to those most directly hurt by the recession; and direct government investment spending. The first three are tax changes of some kind and are estimated to be roughly one-third of the total package; the second two represent emergency measures and are also estimated to be roughly one-third of the total; the last encompasses a range of direct spending and covers the remaining one-third.
We divide the outlays and tax reduction data into these functional categories as follows. Individual tax cuts include the Making Work Pay tax credit, the child tax credit, and a number of smaller individual tax reductions. We also include direct payments that were made in lieu of a tax cut to certain groups. These include payments of $250 distributed to individuals who receive Social Security and Supplemental Security Income, Railroad Retirement benefits, or veterans’ benefits. The business tax incentives and AMT relief are calculated directly by the Office of Tax Analysis (OTA) as part of its simulation process.3
We define state fiscal relief to include just the two main programs in this category: a substantial increase in the Federal government’s matching percentage for Medicaid spending (FMAP), and formula grants to state governments for education through the State Fiscal Stabilization Fund. Aid to those directly impacted by the recession includes the increase and extension of unemployment benefits, increased funds for nutritional assistance, and increases in the Temporary Assistance to Needy Families program. Similarly, the government’s subsidy of continuing health insurance benefits under COBRA, which is technically a business tax cut, is treated as aid to directly impacted individuals for our functional classification.
Government investment outlays include everything else. The obvious components are spending on infrastructure, health information technology, research on renewable energy, and other forms of direct spending excluding transfers. Also included here are tax credits for particular types of private spending, such as weatherization, advanced energy manufacturing, or research and experimentation, since these credits are functionally similar to the direct government spending.
Trends and Developments
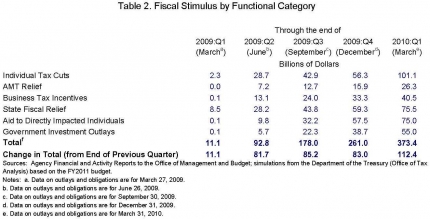
Table 2 shows our breakdown of aggregate outlays and tax relief into these functional categories. For the impact on the economy, what matters is less the cumulative level of expenditures under the Act, but rather the amount spent each quarter. For this reason, Table 2 also reports the change in the total budgetary impact from the end of the previous quarter.
The table shows important changes over time in the magnitude and composition of the fiscal stimulus. After being stable at roughly $80 to $85 billion per quarter over the last three quarters of 2009, total outlays plus tax cuts rose to $112 billion in the first quarter of 2010. This surge stems from increases in individual tax credits and AMT relief. This was expected: families are making smaller payments or receiving larger refunds on their 2009 tax returns due to the tax provisions of the Recovery Act. Section IV discusses in detail the tax credits available in the ARRA, how families are benefiting, and the impact these credits are having on the overall economic recovery.
The composition of the stimulus has evolved as well. As was anticipated at the time of passage, the individual tax cuts and the state fiscal relief were the first items that could be put into effect. For this reason, they comprised a large fraction of total spending in the second quarter of 2009. Aid to those directly impacted by the recession rose substantially in the third and fourth quarters of 2009, reflecting programs like emergency unemployment compensation that provided support to people laid off during the downturn.
Looking forward, we expect government investment outlays on items such as infrastructure and clean energy to account for a growing share of the stimulus. Government investment outlays have already increased substantially, rising from just $6 billion through the end of the second quarter of 2009 to $55 billion through the end of the first quarter of 2010. An additional $128 billion has been obligated for government investment spending, in many cases representing projects that have already begun but not yet received full federal reimbursement. As the economy continues to recover and the ARRA turns toward “reinvestment,” about half of the spending still to come will take the form of government investment outlays.4
Continue to III. Evidence of the Economic Impact of the Recovery Act
1 The outlays and obligations data are based on weekly reports by the relevant agencies. To ensure that our report is as up-to-date as possible, we use the agency Financial and Activity Reports provided directly by the Office of Management and Budget. These reports are posted on Recovery.gov with a short lag. The tax reduction estimates are based on the Department of the Treasury Office of Tax Analysis (OTA) tax simulation model for the effect of the ARRA tax provisions. The OTA prepares new estimates semi-annually as part of the annual budget cycle and the mid-session review. The most recent data come from the FY2011 budget cycle. However, the data shown on Recovery.gov do not reflect many of the revisions made by OTA for the FY2011 cycle. To provide the most accurate quarterly estimates of the impact of the ARRA, we report and use the revised tax estimates for all quarters. Because of these revisions, the figures in Table 1 for 2009 differ slightly from those reported in our second quarterly report (CEA, 2010).
2CBO (2009) projected that $184.9 billion would have been spent in fiscal year 2009 (that is, through the third quarter), and $399.4 billion in fiscal 2010. Assuming that the fiscal 2010 budget impact was spread evenly across the four quarters yields total projected spending of $384.6 billion by the end of March 2010. CBO recently published a revised estimate of the direct effect on the deficit of the ARRA of $862 billion (CBO 2010a Appendix A). This number is not comparable to the estimated cost at passage of $787 billion because it does not include adjustments for the effect of the ARRA on spending from regular appropriations or other authorizations, which CBO estimates reduced the effect on the deficit in 2009 and 2010. Most of the increase in CBO’s estimate of the direct effect on the deficit comes from greater outlays on income-security programs.
3 The quarterly estimates of AMT relief are from unpublished analysis by the OTA. The direct payment data are from the agency Financial and Activity Reports, available on Recovery.gov.
4 Combining the CBO estimates for specific categories (CBO, 2010a) with the data shown in Table 2, about 15 percent of the unspent stimulus will take the form of state fiscal relief, 10 percent will go to directly impacted individuals, 30 percent will come through tax provisions, and the remainder will constitute direct government spending. As discussed above, we classify some of the tax credits as direct spending; including the cost of these credits in government spending yields a total share of about one-half.


