Recovery Act Fourth Quarterly Report - Appendix
APPENDIX
ESTIMATED EMPLOYMENT EFFECTS BY STATE
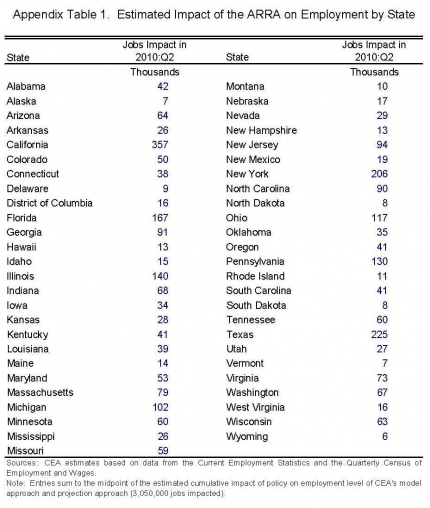
This report finds that the Recovery Act raised employment as of the second quarter of 2010 by between 2.5 million and 3.6 million jobs over what it would otherwise have been. There is obviously much interest in how these employment effects have been distributed across states. In this appendix, we attempt to provide a rough state-by-state breakdown for the effects of the entire ARRA. However, it is important to emphasize that these disaggregate estimates are inherently more speculative and uncertain.
The state estimates are calibrated to add up to 3.05 million jobs. This is the midpoint between the estimated employment impact of the ARRA in 2010:Q2 according to the CEA model approach and the CEA statistical projection approach (see Table 9).
Because there is no perfect way to measure state-level effects, we pursue three approaches to decomposing employment impacts across states. Our first method allocates jobs according to states’ shares of national non-farm employment as of March 2009.29 Georgia, for example, had 3.0 percent of all employment in the country in March 2009, so is allocated 3.0 percent of total job creation.
Our second method allocates jobs according to the distribution of Recovery Act outlays through June 30, 2010. Georgia has received 2.9 percent of total outlays, so is estimated to receive 2.9 percent of total job creation. This method provides a more direct measure of where ARRA impacts are likely to be felt than does the first approach, but it has an important drawback. Only a portion of the overall Recovery Act stimulus is included in the outlays data. The most important stimulus not included in this approach is tax relief, which comprises almost one-half of total spending plus tax cuts to date. Tax cuts are likely more evenly distributed across states than are outlays, so our use of outlays likely overstates the unevenness of employment effects. Similarly, this method assumes that all of the employment effects of spending in a state are felt within the state. In fact, however, there are important spillovers across states. Thus again, this approach is likely to exaggerate the differences among states.
Our third method relies on the sectoral composition of employment in each state. We estimate the number of jobs created or saved in different industries using a methodology developed in our first quarterly report.30 Specifically, we decompose the response of employment in each sector into two components. First, a rising overall level of employment tends to increase employment in each industry in proportion to its share of the overall economy. We refer to this as the “rising tide” effect. Second, some sectors are more sensitive to the state of the business cycle than are others. The additional employment due to the Recovery Act has therefore almost certainly produced relative expansion of such procyclical sectors, while countercyclical sectors, such as utilities, health care, and government, have seen their shares of total employment shrink relative to what would have been seen in the absence of stimulus. We refer to the resulting changes in sectoral employment as the “cyclicality effect.”
We then assume that any jobs saved or created in a particular industrial sector (for example, mining and logging) are distributed across states in the same way as are existing jobs in that sector.31 Georgia has only 1.4 percent of national employment in mining and logging, so is assumed to receive only 1.4 percent of employment effects in that industry. By contrast, Georgia has nearly one-quarter of national textile product mill employment, so any employment impacts in that industry are assigned disproportionately to Georgia. Summing across 42 industries, we obtain the total impact on Georgia employment.32 The procedure is repeated for each state to obtain the distribution across states.
None of these three approaches does a perfect job of measuring the geographic distribution of employment effects, and each has advantages and disadvantages relative to the others. Thus, to obtain a reasonable estimate of state-level job impacts, we average the three approaches. This average indicates that the ARRA has saved or created roughly 91,000 jobs in Georgia, 3.0 percent of the national total. Estimates for all fifty states, plus the District of Columbia, are reported in Appendix Table 1.
Of course, simply because their populations are larger, we estimate that larger states have seen larger jobs impacts. Similarly, because their employment is more cyclically sensitive, industrial states are estimated to have had larger employment effects relative to their populations. Finally, both because of their industrial composition and because state fiscal relief and aid to individuals directly impacted have been larger in states hit harder by the recession, we estimate that states with higher unemployment rates at the time of passage have seen larger employment effects of the ARRA relative to their populations.

29U.S. Department of Labor (2010b). We use seasonally adjusted estimates of total nonfarm employment.
30 See CEA (2009b) for details.
31 Employment by state and industry is drawn from data published by the U.S. Department of Labor (2009, 2010b). We use data from the March 2009 Current Employment Statistics to determine state employment shares and data from the 2008 Quarterly Census of Employment and Wages to determine state-by-industry employment. Because of limitations in the available data, some of the analysis here uses data beginning in 1990:Q2.
32 For this analysis, we use a relatively detailed industry breakdown. Manufacturing is divided into 21 sectors (for example, fabricated metal products). Trade, transportation, and utilities are divided into four sectors (wholesale trade, retail trade, utilities, and transportation/warehousing); financial activities into two (finance/insurance, and real estate/rental/leasing); professional and business services into five (professional/technical services, management of companies, employment services, other administrative/support services, and waste management/remediation); education and health into two (educational services and health care/social assistance); leisure and hospitality into two (arts/entertainment/recreation and accommodation/food services). For data sources and methods used in the sectoral decomposition, see CEA (2009b).


