According to the most recent census numbers, over the last decade, the Asian American and Pacific Islander (AAPI) communities have been among the fastest growing communities in the country (1). From 2000-2010, the Asian American population grew by 43.3%, outpacing growth of the Latino population over the same period. The Native Hawaiians and Pacific Islanders population grew by 35.4% in the decade. In 2011, AAPIs made up 5.1% of the labor force, including close to 7.5 million workers of Asian descent and close to half a million Native Hawaiians and other Pacific Islanders. By 2020, Asian Americans are expected to comprise 5.7 percent of the U.S. labor force (2).
Like many other groups in the U.S., Asian Americans and Pacific Islanders suffered through the most recent recession. As the economy strengthens, however, the AAPI community has been at the forefront of the recovery.
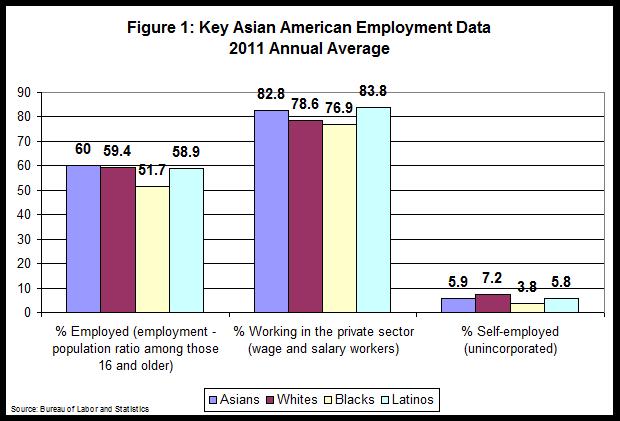
As shown in Figure 1, Asian Americans are more likely than any other group to be employed and more likely to work in the private sector than any other group, except for Latinos (3). As the recession took a toll on many private sector jobs, Asian Americans found opportunities of self-employment as an alternative to the private sector. In 2011, 5.9 percent of Asian Americans were self-employed. According to the most recent Census Bureau Survey of Business Owners, Asian American and Pacific Islanders businesses grew by over 40 percent, a rate that more than doubles the national average between 2002 and 2007. AAPIs make a significant contribution to the economy with their nearly 1.6 million businesses employing almost three million Americans with an annual payroll of over $80 billion.
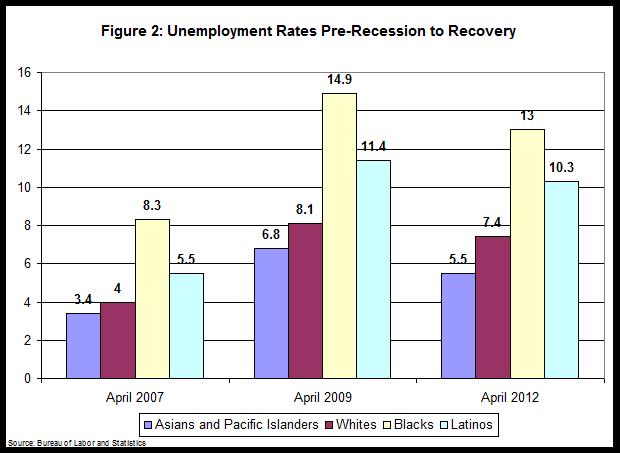
In 2007, prior to the recession, the unemployment rate for Asian Americans and Pacific Islanders was 3.3%, the lowest rate among any racial or ethnic group. Along with that of other groups, however, the AAPI unemployment rate rose as the economy entered the recession that same year. In 2010, the AAPI unemployment rate peaked at 7.8%. The community has seen improvement during the recovery, as has much of the rest of the country. In April 2012, the AAPI unemployment rate dropped to 5.5% from an unemployment rate of 7.2% just one year earlier.
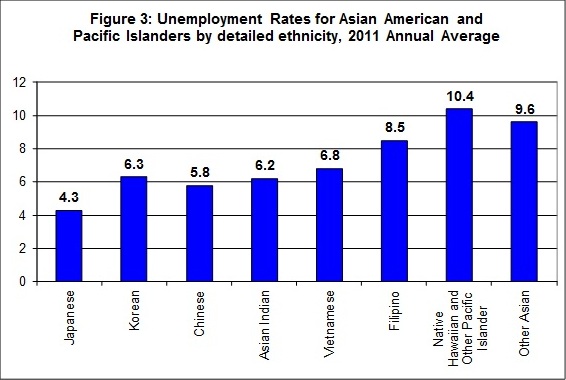
Importantly, though AAPIs experience the lowest unemployment rate, the unemployment rates for various groups within the AAPI community vary widely. Figure 3 shows that in 2011 the unemployment rates for workers of Native Hawaiian and Pacific Islanders, Filipino, and Vietnamese ancestry were 10.4, 8.5 and 6.8 percent, while unemployment rates for workers with Korean, Asian-Indian, Chinese and Japanese ancestry are 6.3, 6.2, 5.8 and 4.3, respectively.
Furthermore, AAPI college graduates are more likely than their white college graduate counterparts to be unemployed. In 2011, 3.9 percent of white college graduates were unemployed, as compared to AAPI college graduates whose unemployment rate was 5.2 percent. Also, Asian Americans who are unemployed, on average, face longer periods of joblessness than any other ethnic group (4). About 50 percent of unemployed Asian Americans have been unemployed for more than 26 weeks, the highest among any group, which is why past and recent extensions of unemployment insurance for the long-term unemployed have been particularly important to the Asian American community.
Looking ahead, the Asian American community is well-positioned to benefit from jobs in growing sectors (5). The professional, scientific and technical service industry is expected to grow at 2.6 percent annually and to be among the fastest growing industries in the next decade. In 2010, Asian American workers were overrepresented in this industry, with 8.3 percent of the jobs in this industry. Within scientific occupations, Asian Americans are similarly well represented. Asian Americans hold about 9 percent of the jobs in science, technology, engineering and math (STEM) occupations. Asian Americans are also over-represented in health and social assistance, the fastest growing sector over the next ten years. If trends continue, Asian American workers will be in a strong position to take advantage of the growth in these sectors and continue supporting the country through this time of economic recovery.
(1) Asian American and Pacific Islander data in this report is a combination of Department of Labor and Census Bureau data on Asian American and Native Hawaiians and Pacific Islanders. Given the small size of the Native Hawaiian and Pacific Islander population, data on this community are not available for every topic discussed in this blog. In those instances the data refer only to Asian Americans.
(2) The Department of Labor is unable to forecast labor force growth for Native Hawaiians and Pacific Islanders.
(3) Figure 1 covers only Asian Americans. Private sector and self-employment data is not available for Native Hawaiians and Pacific Islanders.
(4) Data on unemployment duration is not available for Native Hawaiian and Pacific Islanders.
(5) Per BLS: Data on employment projections is not available for Native Hawaiian and Pacific Islanders
Dr. Adriana Kugler is the Chief Economist at the U.S. Department of Labor.


