

The Final State of the Union
With today’s strong employment report, we have now seen eleven straight months of job gains above 200,000—the first time that has happened in nearly two decades. We are also seeing nominal wage growth exceed the latest inflation readings, but additional steps are still needed to overcome the long-standing challenges affecting wages and family incomes. America is poised for another strong year, and so it is critical to avoid brinksmanship and unnecessary austerity, and instead to make investments in our future growth. That’s why earlier this week the President released a budget proposal that will help hardworking families make ends meet, while boosting America’s productivity and giving workers the tools they need to secure well-paying jobs in the 21st-century global economy.
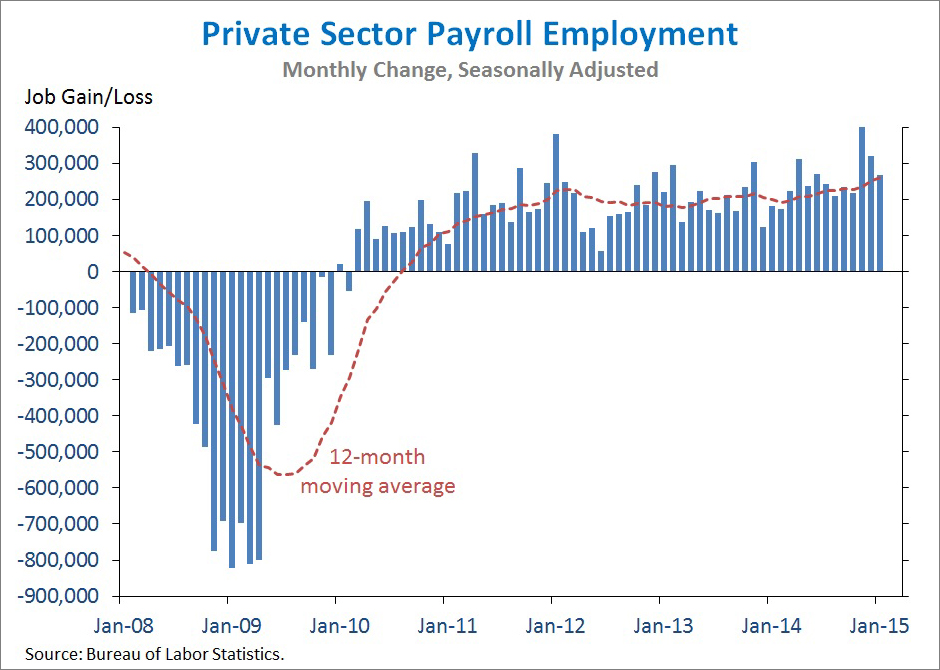
1. The private sector has added 11.8 million jobs over 59 straight months of job growth, extending the longest streak on record. Today we learned that total nonfarm payroll employment rose by 257,000 in January due to a 267,000 increase in private-sector employment. Private-sector job growth was revised up for November and December by a combined 149,000 jobs, so that over the past twelve months, private employment has risen by 3.1 million, the largest twelve-month gain since 1998.
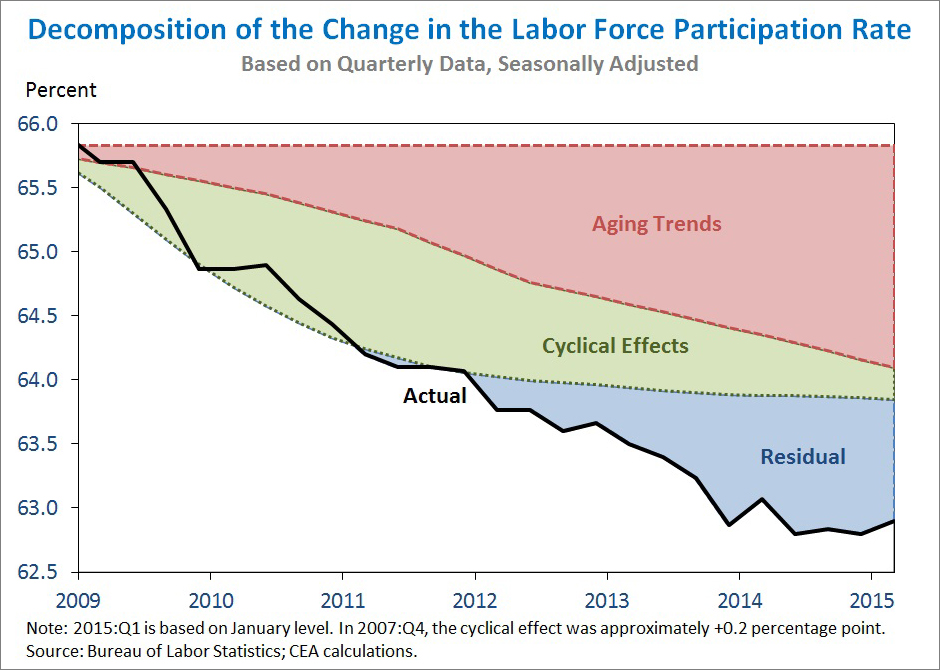
2. The labor force participation rate rose to 62.9 percent in January, and has been relatively stable, on balance, since October 2013—during which time the unemployment rate has fallen by 1.5 percentage point. The recent stabilization in the participation rate suggests that all of the decline in the unemployment rate over the past fifteen months has been due to employment gains. Over the recovery as a whole, the participation rate has fallen, in large part because of two simultaneous events that hit in 2008: the worst economic crisis since the Great Depression, and the beginning of a retirement boom as the first Baby Boomers became eligible for Social Security. Last summer, the Council of Economic Advisers released a report elaborating on these and other factors driving the decline in the participation rate. Updating the analysis to account for today’s data, CEA estimates that of the 3.0 percentage-point decline in the participation rate from 2007:Q4 to January 2015, 1.8 percentage point is due to the natural aging of the population and 0.5 percentage point is due to standard business-cycle effects. The remaining 0.8 percentage point is a “residual” that could reflect either less-well-understood pre-existing trends or lingering after-effects from the unusual severity of the Great Recession. (Components do not sum to total due to rounding.) Although the effect of an aging population is likely to exert downward pressure on the participation rate for years to come, the President has proposed a number of policy steps that can help support labor force participation and the economy’s long-run potential output. An updated discussion of the labor force participation rate and policy implications will appear in the forthcoming Economic Report of the President.
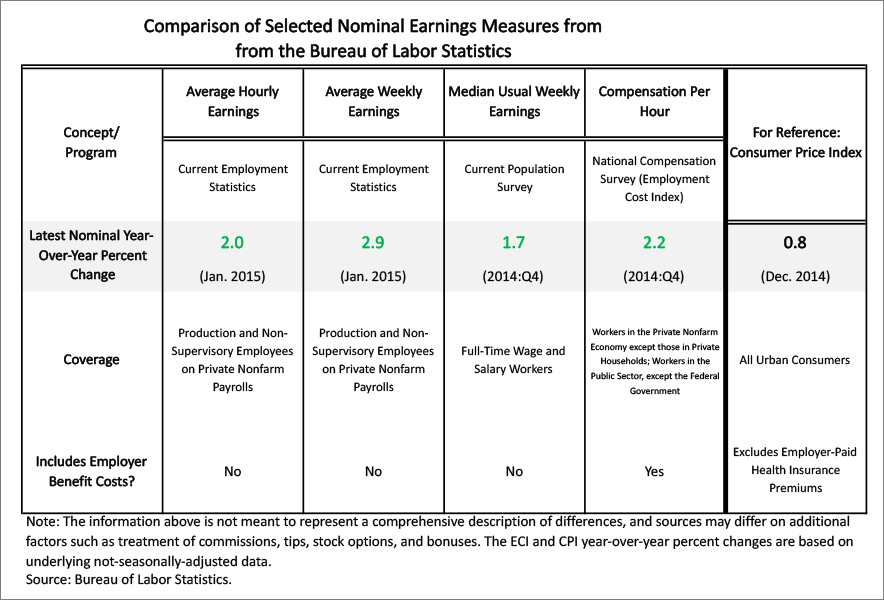
3. Nominal average hourly earnings for private production and non-supervisory workers have risen 2.0 percent over the last twelve months -- implying real wage growth of around one percent, but still below rates needed to overcome the long-standing challenge in this area. The average hourly earnings data released today is one of several nominal earnings measures produced by the Bureau of Labor Statistics. As summarized in the table below, these measures differ on a number of dimensions, including the types of workers covered, the treatment of employer-sponsored benefits, and the timeliness of publication. The latest available readings on these measures range from a 1.7 percent year-over-year increase (in median usual weekly earnings of full-time wage and salary workers) to a 2.9 percent year-over-year increase (in average weekly earnings for private production and non-supervisory workers). In all cases, the latest year-over-year increase is higher than the latest year-over-year increase in the Consumer Price Index (0.8 percent as of December 2014). Collectively, these data show that real (inflation-adjusted) earnings are increasing, but the rates of real wage growth suggest that more must be done to ensure that all families can feel the strengthening recovery in their own lives.
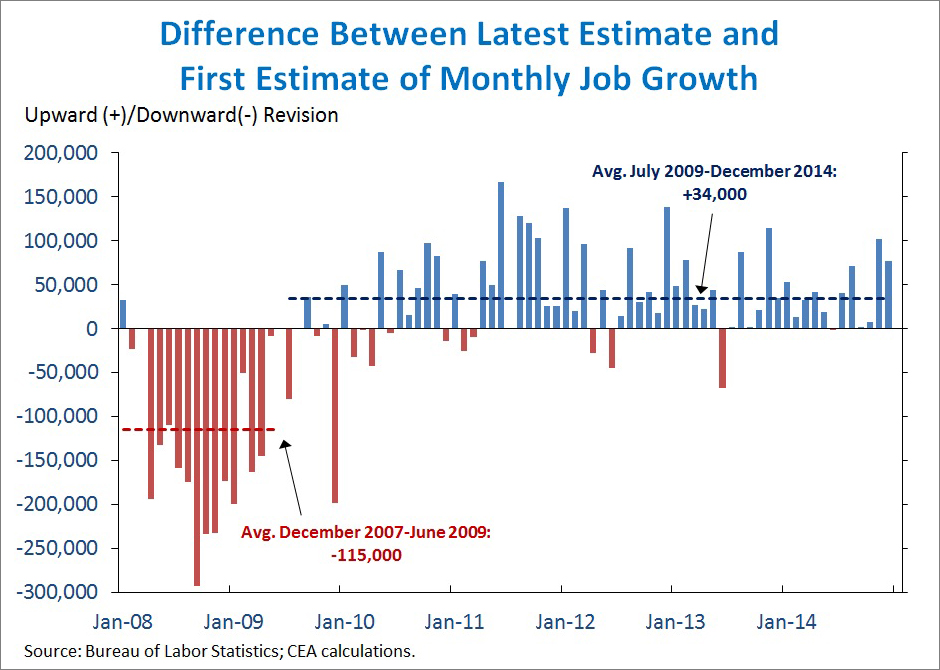
4. Consistent with a general pattern of upward revisions during the recovery, job growth in November and December was revised up substantially, and the benchmark revision to March 2014 added 91,000 jobs (on a seasonally adjusted basis). Revisions to jobs numbers tend to be cyclical (negative in a recession, positive in a recovery) in part because at the time of the first report, the Bureau of Labor Statistics (BLS) is missing data from firms that have not responded to the survey, as well as data on business start-ups and closures. BLS uses a model to estimate missing data, but these model-based estimates are backward-looking, so they understate both the declines in a recession and the gains in a recovery. Over time, BLS is able to replace initial survey reports and model-based estimates with more comprehensive data drawn from administrative records. Since July 2009, the latest data are an average of 34,000 a month higher than the first report, indicating that the recovery has been stronger than initially estimated. However, during the recession from December 2007 to June 2009, first reports of monthly job growth were revised down by an average of 115,000 a month, meaning that the recession was deeper than originally estimated.
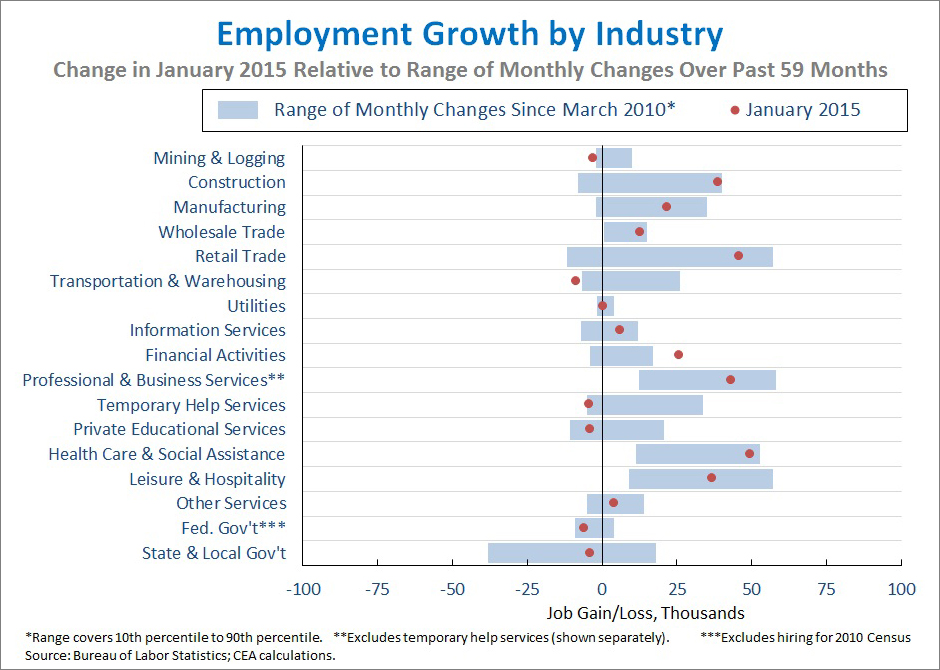
5. Job growth in a number of industries diverged from recent trends in January. Looking over the 59-month streak of private-sector job growth, January was one of the top ten strongest months for construction (+39,000), retail trade (+46,000), financial activities (+26,000), and health care and social assistance (+50,000). However, January was also one of the ten weakest months for mining and logging (-3,000), transportation and warehousing (-9,000), and temporary help services (-4,000). Manufacturing added 22,000 jobs in January, in line with its average over the past year, and has added 877,000 jobs since February 2010. Across the 17 industries shown below, the correlation between the most recent one-month percent change and the average percent change over the last twelve months fell to just 0.09, the lowest in over two years, reflecting the high number of industries that saw unusually divergent performances in January.
As the Administration stresses every month, the monthly employment and unemployment figures can be volatile, and payroll employment estimates can be subject to substantial revision. Therefore, it is important not to read too much into any one monthly report and it is informative to consider each report in the context of other data that are becoming available.

