

The Final State of the Union
The economy added 215,000 jobs in July, while the unemployment rate held steady at 5.3 percent—its lowest level since 2008. Over the past two years, our economy created 5.7 million jobs, the strongest two-year job growth since 2000. And our businesses have created 13.0 million jobs over the past 65 straight months, extending the longest streak on record. But despite the rapid pace of recent growth, some slack left over from the financial crisis remains in our labor market, and there is more work to do to ensure that we continue to make progress. That’s why the President is committed to pushing Congress to increase investments in infrastructure as part of a long-term transportation reauthorization, opening new markets for U.S. goods and services through expanded trade, providing relief from the sequester, and raising the minimum wage.
FIVE KEY POINTS ON THE LABOR MARKET IN JULY 2015
1. The private sector has added 13.0 million jobs over 65 straight months of job growth, extending the longest streak on record. Today we learned that private-sector employment rose by 210,000 in July. Our businesses created more than 200,000 jobs in fifteen of the past seventeen months. In fact, we have created over 5.5 million private-sector jobs over the past two years—more than in any two-year period since 1997-1999.

2. The unemployment rate has fully recovered from the Great Recession, and broader measures of the labor market show substantial progress but still point to some remaining slack. With today’s report, the headline unemployment rate (on an unrounded basis) moved below its pre-recession average for the first time in the recovery. While this milestone is a testament to the strength of the labor market recovery so far, several alternative measures of labor market strength have not fully recovered, and some level of slack remains. For example, the long-term unemployment rate is 34 percent above its pre-recession average. The slower recovery in the long-term unemployment rate is offset by the short-term unemployment rate, which is now below its pre-recession average. More noticeably, the U-6 “underemployment rate”—a broader measure than headline unemployment that includes discouraged workers and those employed part time while preferring to work full time—remains 14 percent above its pre-recession average. The female and Hispanic populations’ unemployment rates are not yet fully recovered, but unemployment rates for male, black, white, and Asian American workers are now below their pre-recession averages.
![]()
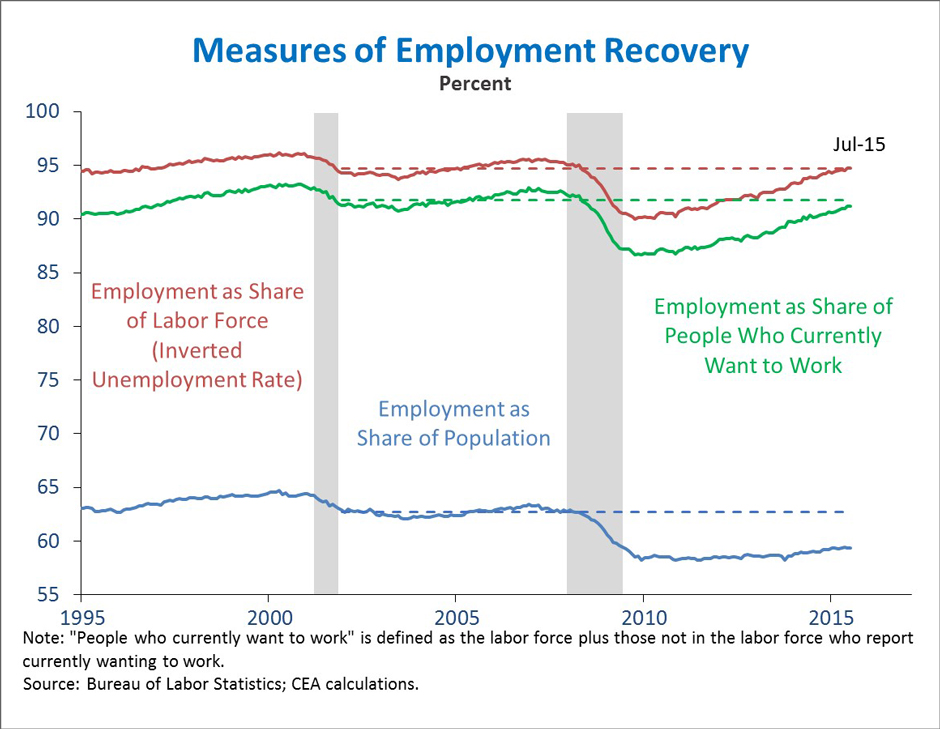
3. When measuring the labor market recovery, it is critical to control for the effects of demographic and structural changes. The age distribution of the U.S. population has become markedly older in recent years, and increasing numbers of baby boomers are entering retirement. Accordingly, employment as a share of population (the “e-pop” ratio) is much lower today than it was a decade ago, since such a large fraction of the population has moved beyond working age. While these demographic shifts are important for understanding the economy’s structure and long-term trajectory, they provide little information about its cyclical recovery. Cyclical patterns in employment should be measured against a baseline that in some way reflects these structural trends. Measuring employment as a share of the labor force helps accomplish this goal. This is the approach taken by the headline unemployment rate, which has now fully recovered to its pre-recession average.
Some commentators have asserted that the unemployment rate is a misleading measure because the post-crisis decline in the labor force reflects more than demographic factors. CEA has also found that other factors beyond demographics have reduced the labor force, although demographics appear to be the largest factor. One broader baseline than size of the labor force is the set of all people who report that they “currently want to work,” since 2-3 percent of the population reports wanting a job but are not considered part of the labor force. Even when considering employment as a share of all those who report “currently wanting to work”—a broader group than the labor force—employment has nearly returned to its pre-recession average. This comparison suggests that the difference between the unemployment rate, which is back to previous levels, and e-pop, which is not, is mostly explained by those who report that they “do not currently want to work”—mostly because they are above working age.
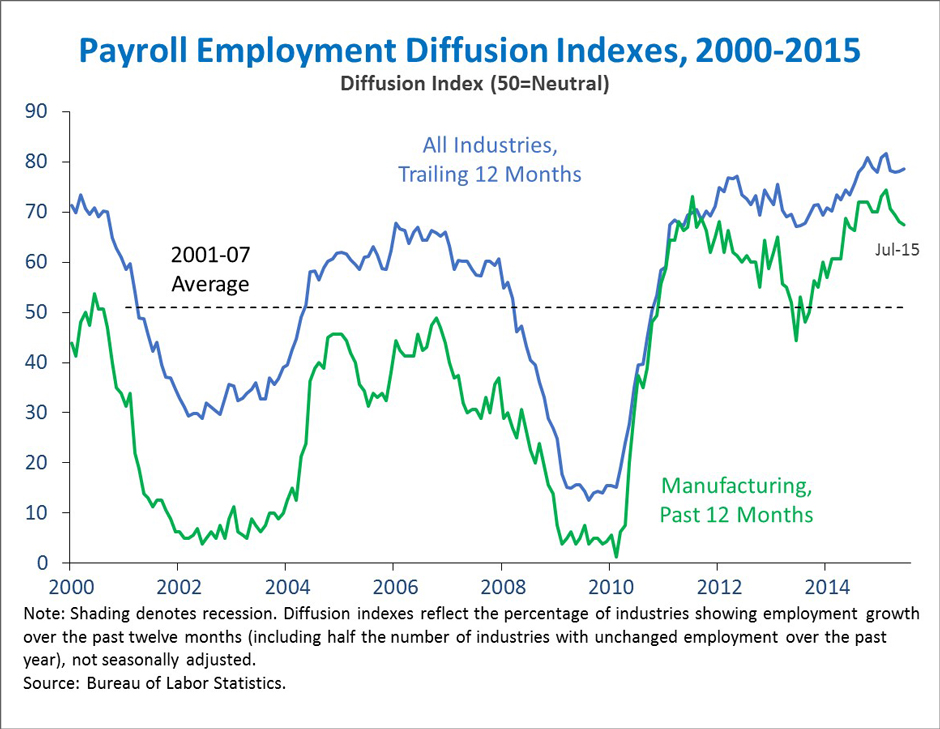
4. Job losses during the Great Recession were broad-based across industries, and job gains during the recovery have been similarly widespread. The payroll employment “diffusion index” is a measure of the share of industries that have added jobs over the trailing twelve months. During the recession, employment loss was especially widespread across industries, as the diffusion index bottomed at 12.5 percent in August 2009. Over the past 12 months, the index has averaged 78.9 percent—the highest 12-month average since 1998. This fact suggests that employment growth over the past year has been more broad-based than in recent decades. The same pattern is true when considering only manufacturing industries, as the rebound in U.S. manufacturing employment since the financial crisis has followed a secular decline over the prior two decades.
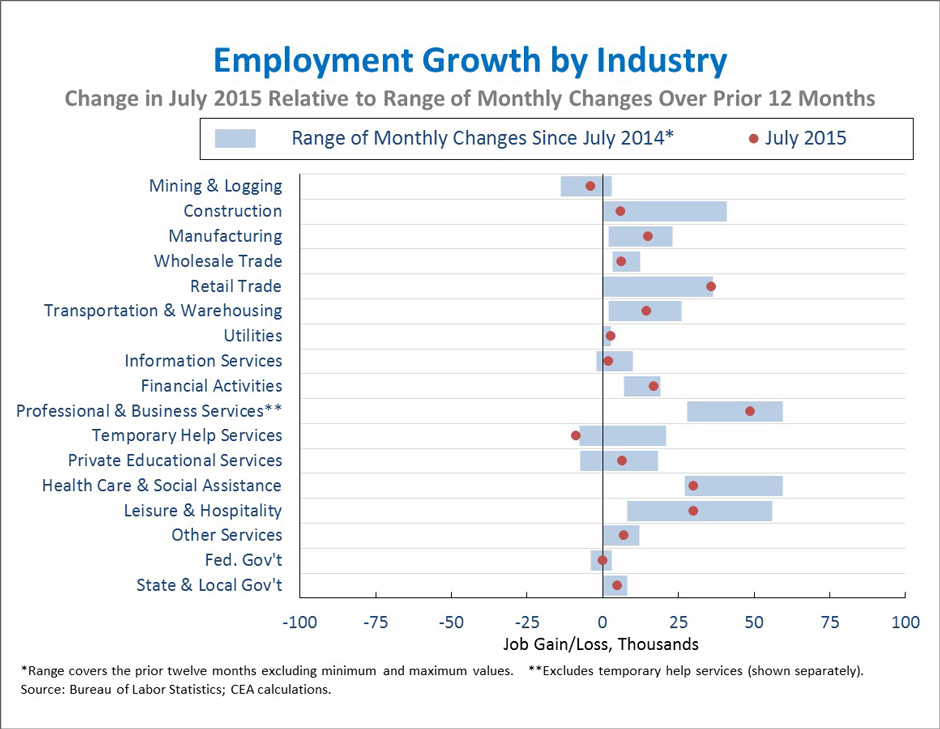
5. The distribution of job growth across industries generally followed recent trends in July, but some industries saw especially strong or weak months. July was an especially strong month for utilities (+3,000), retail trade (+36,000), financial activities (+17,000), and private educational services (+7,000). July was a weaker than usual month in temporary help services (-9,000), construction (+6,000), health care and social assistance (+30,000), and information services (+2,000). Across the 17 industries shown below, the correlation between the most recent one-month percent change and the average percent change over the last twelve months declined to 0.58 from 0.86 last month, roughly in line with the average correlation over the past two years.
As the Administration stresses every month, the monthly employment and unemployment figures can be volatile, and payroll employment estimates can be subject to substantial revision. Therefore, it is important not to read too much into any one monthly report and it is informative to consider each report in the context of other data as they become available.
Jason Furman is Chairman of the Council of Economic Advisers.

