Today, the Administration announced that the National Geospatial-Intelligence Agency (NGA), the National Science Foundation (NSF), and the University of Minnesota’s Polar Geospatial Center (PGC), were collaborating to use high-resolution satellite imagery from DigitalGlobe, processed with NSF-supported advanced computing resources Blue Waters and the Extreme Science and Engineering Discovery Environment (XSEDE), to produce improved, publicly available Digital Elevation Models (DEMs) of Alaska by mid-2016, and of the entire Arctic by the end of next year. This effort will complement the on-going Alaska Mapping Initiative, led by the U.S. Geological Survey (USGS)’s 3D Elevation Program with support from the State of Alaska and other Federal agencies to acquire high-resolution elevation data from interferometric synthetic aperture radar (ifsar), data that will be used to update topographic mapping in Alaska.
This announcement, which directly supports President Obama’s Executive Order calling for enhanced coordination of National efforts in the Arctic, marks a significant achievement in the world of geospatial mapping. Elevation data is a very common resource in the lower 48 states, where small aircraft that can be outfitted with data-collection sensors abound. But the farther you move away from airports and modern infrastructure, the more elusive these data become. Over the past five years, with the goal of enabling scientific research, NGA, NSF, and PGC have been working together to fill this gap by using satellites – which aren’t limited in spatial coverage by the availability of airfields and other facilities – to collect high-resolution imagery that can be turned into elevation data for the entire Arctic.
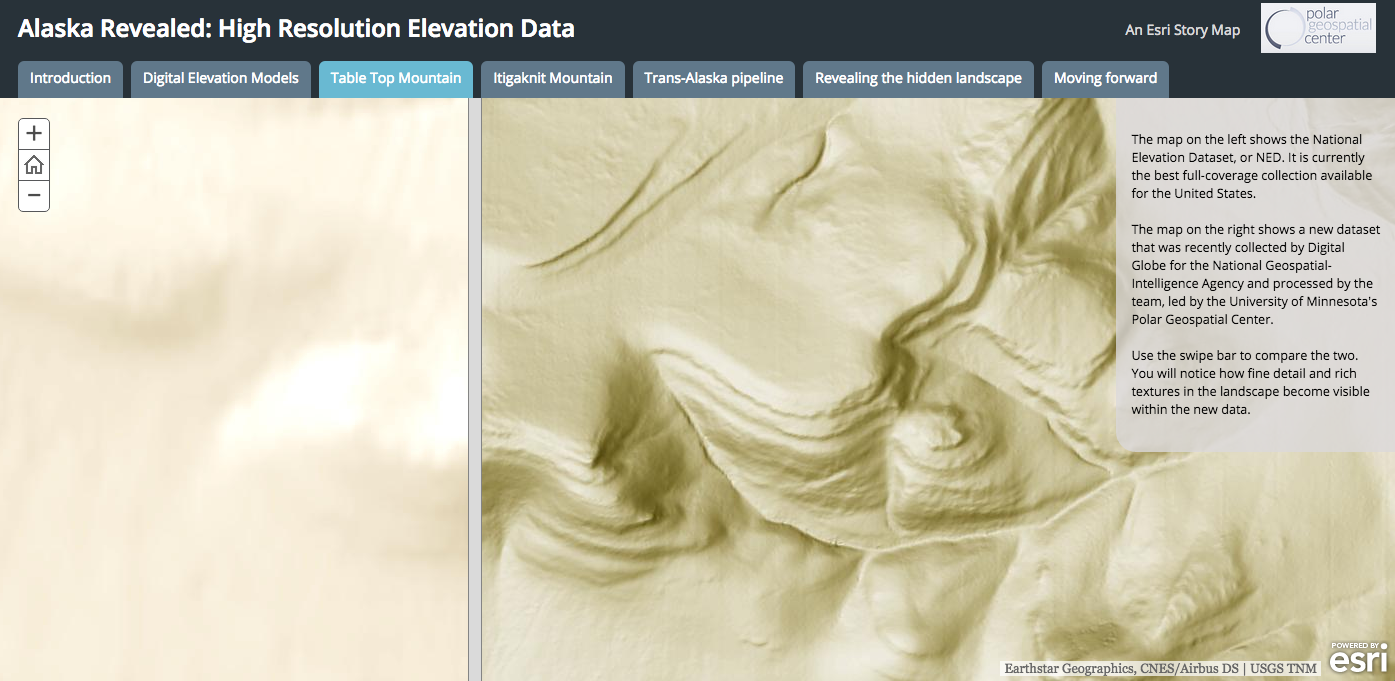
Such data can be processed in ways that enable better understanding of the shape of the Arctic surface at an unprecedented level of detail. As part of a supporting commitment to help users discover and engage with the new elevation data, Geospatial Information System (GIS) company Esri is developing new interactive resources like the slider below, which compares an elevation map of Alaska’s Tabletop Mountain based on the best data previously available with an identical map based on the new data.
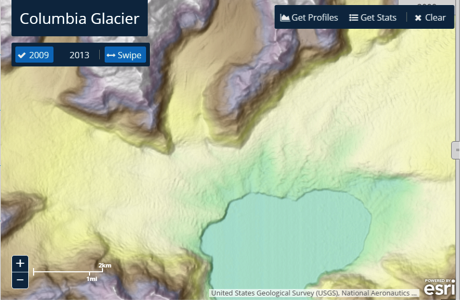
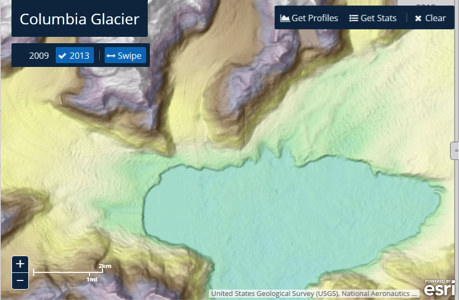
Elevation data and data products support informed land management, sustainable development, safe recreation, and scientific studies, as well as domain-specific challenges inherent to the aviation, transportation, and defense industries. The data can also serve as a benchmark against which future landscape changes (due to, for instance, erosion, extreme events, or climate change) can be measured, as demonstrated in this visualization of the retreat of the Columbia Glacier in Alaska: 
Comparison of the Columbia Glacier in 2009 (left) and 2013 (right). To explore the Columbia Glacier retreat for yourself, click here. (Visualization credit: Esri)
Read on for examples of these applications.
Sea Level Rise and Storm Surge
As the global climate changes and sea level rises, storm surge has become an increasingly salient danger. Hurricanes Katrina and Sandy, for instance, induced storm surge that led to flooding and considerable damages in New Orleans, New York, and surrounding areas. As the Arctic warms, sea ice is reduced and the area of open water increases, enhancing the potential for storm-surge effects. Many Arctic coastal communities, therefore, are also at risk of being overwhelmed by storm surge, but few have the data and information needed to respond effectively.
A case in point is Point Hope, a small village of less than 700 people on a barrier island in Northwest Alaska’s Chukchi Sea. The ocean is within sight of every house of Point Hope, and every house is within a few short vertical feet of the current sea level. Better elevation maps can be used to quantify changes in sea level and monitor coastal erosion in order to identify buildings and critical infrastructure at high risk of storm-surge damage, and to identify safe places to shelter when storms come. 
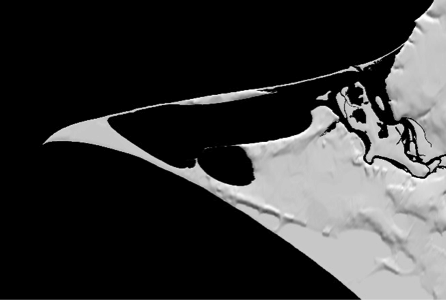
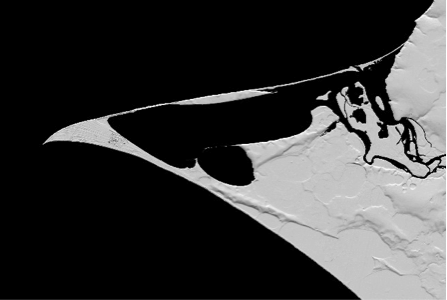
The image on the left shows a map of Point Hope (the sandbar) based on the NED; the image on the right shows the same map based on the new elevation data. Over the next year and a half, improved elevation maps like the one on the right will be available for all Arctic communities. (Image credit: Paul Morin, PGC. From DigitalGlobe imagery.)
Sea Level Rise Before it Rises
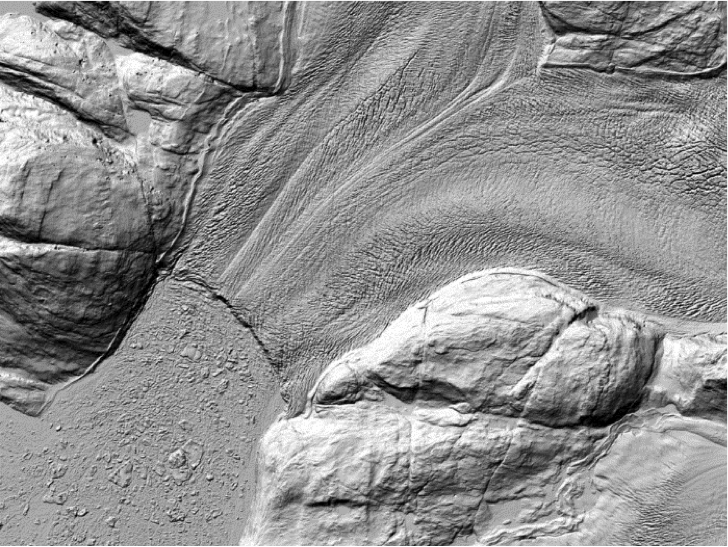
DEMs can be used to precisely measure the volume of glaciers and assess how volume is changing from month to month and year to year. This in turn enables researchers to predict how the melting of terrestrial ice will contribute to sea-level rise – a key component of helping planners and decision makers anticipate and prepare for the impacts of climate change.
Protecting the Health of Arctic Communities
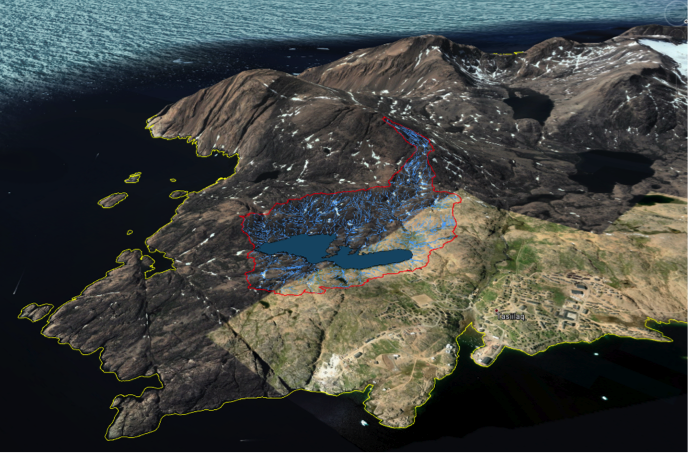
The people of the Arctic live very close to the landscape. Hunting and fishing are major sources of nutrition, and drinking water often comes straight from nearby lakes and rivers. DEMs can be used to identify the “catchment” of water supplies – the area that drains into for a particular lake, river, or other reservoir – for Arctic communities, making it possible to keep refuse, petroleum, pets, and other possible contaminants out of the area in order to maintain drinking-water quality.
Additional Resources
As the new DEMs become available, they will be publicly accessible through NGA’s public website www.nga.mil or directly at nga.maps.arcgis.com. This portal already contains other Arctic geospatial information products, including a Pan-Arctic Map that includes multiple layers of downloadable information and data.
The DEMs will be complemented by new interferometric synthetic aperture radar (ifsar) data for Alaska collected by the U.S. Geological Survey’s 3D Elevation Program, in partnership with the State of Alaska and other Federal agencies. To date, this program has secured data coverage for over 50% of the State. More information on this effort is available here, and all of the high-resolution ifsar elevation data, new topographic maps based on this data, and related data, will be available on The National Map web portal.
Users can also explore the new Arctic elevation data through online story maps developed by Esri, available here and here.
Fabien Laurier is Senior Policy Advisor and Interim Director of the National Climate Assessment at the White House Office of Science and Technology Policy.
Hannah Safford is a SINSI Fellow at the White House Office of Science and Technology Policy.
