

The Final State of the Union
The robust pace of job creation continued in February as the unemployment rate held at its lowest level since February 2008 and labor force participation rose. Over the past two years, our economy added more private-sector jobs than in any two years since 1999. While these trends speak to the strength of the labor market recovery, and while wages have grown faster than inflation over the last year, more work remains to drive faster wage growth, including investing in infrastructure, implementing high-standards free trade agreements like the Trans-Pacific Partnership, and raising the minimum wage. As discussed in the 2016 Economic Report of the President, these policies are key parts of the President’s agenda for inclusive growth and would help ensure that the benefits of economic growth are shared with all Americans.
FIVE KEY POINTS ON THE LABOR MARKET IN FEBRUARY 2016
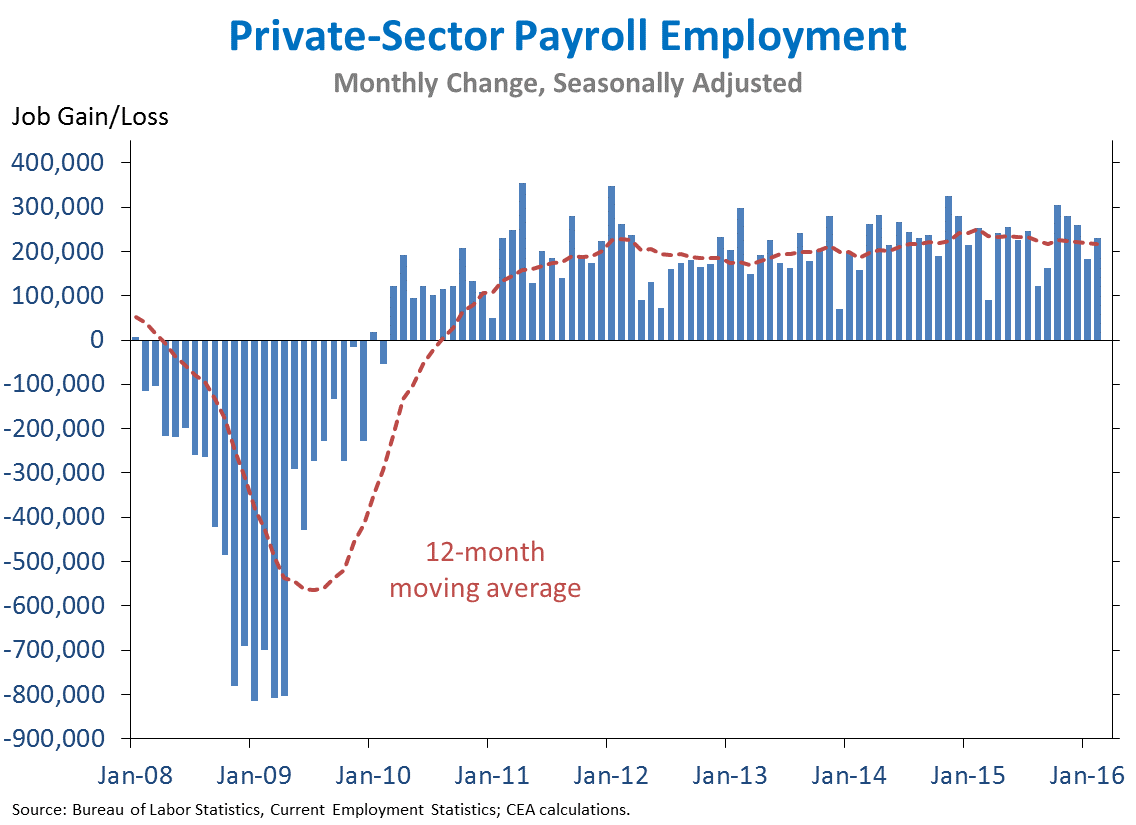
1. U.S. businesses have now added 14.3 million jobs over six straight years, extending the longest streak on record. Today we learned that private employment rose by 230,000 jobs in February, while private employment growth in December and January was revised up by a combined 32,000 jobs. The unemployment rate held steady at 4.9 percent in February, while the labor force participation rate rose to 62.9 percent, reaching the same level as the end of 2013. Over the past 24 months, the private sector added 5.6 million jobs, the most in any two-year period since 1999.
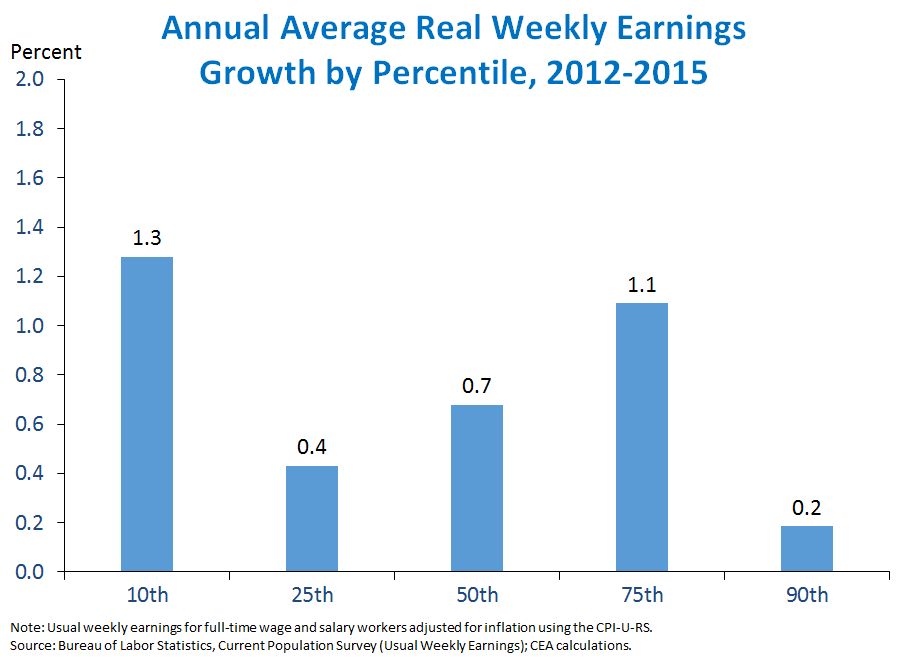
2. Gains in weekly earnings have benefited workers across the earnings distribution over the past three years. Usual weekly earnings have risen faster than inflation over the past three years, with the largest gains for workers at the 10th percentile and the smallest gains for workers at the 90th percentile. Other data also show gains being shared by a wide range of workers. For example, private production and nonsupervisory employees (a group that roughly represents the bottom 80 percent of workers) have seen real annual growth of 1.3 percent in their average hourly earnings over the past three years. These changes, however, represent only a very partial reversal of the decades-long increase in earnings inequality that continued through the early stages of the current recovery. As discussed in Chapter 1 of the 2016 Economic Report of the President, the President’s agenda for inclusive growth would address this challenge by increasing opportunity and ensuring that competitive markets work more efficiently.
3. The broadest measure of labor underutilization declined 0.2 percentage point to 9.7 percent in February, its lowest level since May 2008. While the headline unemployment rate, the U-3 rate, includes only unemployed persons who have looked for work in the last month, the broadest measure of labor underutilization, the U-6 rate, also includes both those who have looked for work in the past year but not in the past month (“marginally attached to the labor force,” a group that includes discouraged workers) and those employed part-time who would prefer to work full-time (“part-time for economic reasons”). During the recession, the U-6 rate reached a record high of 17.1 percent, driven both by a sharp rise in unemployment and an increase in the share of the labor force working part-time for economic reasons (see point 4 below). Since this peak, however, the U-6 rate has recovered 93 percent of the way to its pre-recession average and over the past year has fallen faster than the headline unemployment rate. The U-6 rate is now the only measure of labor underutilization that remains above its pre-recession average, with discouraged workers and the marginally attached nearly recovered and the overall unemployment rate more than recovered (though tilted more towards long-term unemployment). The remaining elevation in the U-6 rate relative to its pre-recession average is entirely attributable to a still-elevated rate of part-time work for economic reasons.

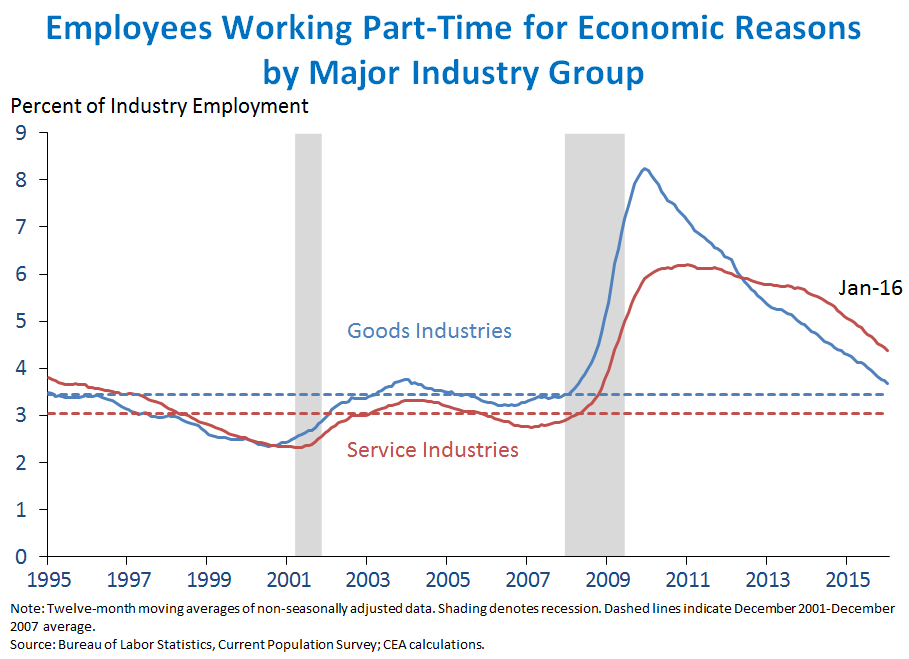
4. Most of the remaining elevation in the share of employees working part-time for economic reasons is concentrated in service industries. The rate of part-time employment for economic reasons—which rises in recessions as employers cut back their demand for work hours—doubled in the Great Recession from 3.0 percent to 6.0 percent of the labor force, a sharper increase than in earlier downturns. As shown in the chart below, this initial increase was larger in goods industries (such as construction and manufacturing), which tend to be more cyclically responsive than service industries. However, over the course of the recovery the share of goods-industry employees working part-time for economic reasons has fallen steadily, with much of the remaining elevation in the overall rate of part-time work for economic reasons due to elevation of the rate in the service sector.
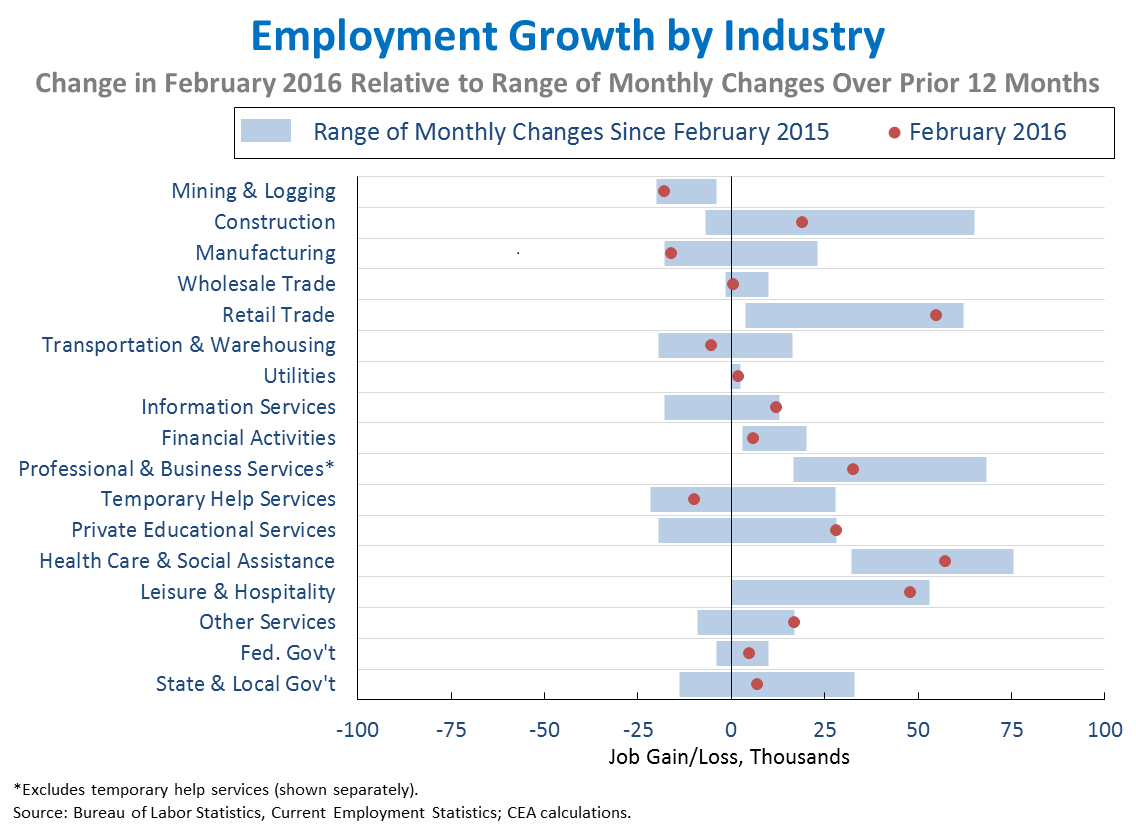
5. February was a strong month for employment growth in many sectors, although global headwinds continue to restrain job growth in certain industries. Especially strong gains relative to the past year were seen in industries such as retail trade (+55,000), private educational services (+28,000), and information services (+12,000). Manufacturing (-16,000) had a noticeably weaker-than-average month following a relatively strong gain of 23,000 jobs in January. Mining and logging employment, which includes oil extraction, continued to decline (-18,000). Slowing global growth has weighed on job growth in both of these industries, as weaker foreign demand has put pressure on U.S. exports and has contributed to the decline in oil prices. Across the 17 industries shown below, the correlation between the most recent one-month percent change and the average percent change over the last twelve months was 0.92, above the average correlation over the previous three years.
As the Administration stresses every month, the monthly employment and unemployment figures can be volatile, and payroll employment estimates can be subject to substantial revision. Therefore, it is important not to read too much into any one monthly report, and it is informative to consider each report in the context of other data as they become available.

