
2010 National Survey on Drug Use and Health
The National Survey on Drug Use and Health (NSDUH) is the primary source of information on the prevalence, patterns, and treatment admissions for substance use among people age 12 and older. The survey is conducted every year by the Substance Abuse and Mental Health Services Administration (SAMHSA) and is the largest government survey of its kind.
The 2010 NSDUH shows there were no statistically significant one-year increases from 2009 to 2010 in any past-month illicit drug-use category for any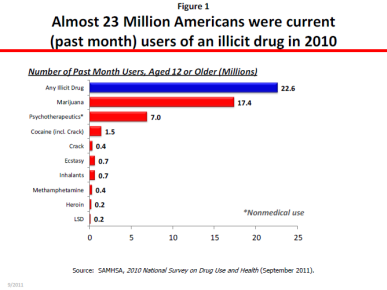 age group (12 to 17, 18 to 25, or 26 and older).
In 2010, an estimated 22.6 million Americans (8.9 percent) aged 12 or older were current (past-month) users of illicit drugs (figure 1). This is statistically unchanged from the estimate of 21.8 million (8.7 percent) in 2009. The 2010 estimate is the peak level for this measure in the period from 2002- 2010 and represents a 13 percent increase over 2008 (8.0 percent).
Prescription Drugs
While the prevalence of the non-medical use of prescription drugs has been relatively stable in recent years, the consequences of their abuse have been rising. According to findings from other Federal data systems, rates of drug overdose deaths—driven primarily by pain relievers—increased roughly five-fold between 1990 and 2007; the proportion of substance abuse treatment admissions reporting any pain reliever abuse increased more than four-fold between 1998 and 2008; and emergency department visits involving the misuse or abuse of pharmaceuticals increased 98 percent between 2004 and 2009 and, in 2009, exceeded the number of visits attributable to the use of illicit drugs.
Ages 12 and older
- The estimated number of current non-medical users of prescription drugs was up 12 percent from 2008 (6.2 million) but unchanged from the estimates since 2005.
-
The estimated number of current non-medical users of pain relievers has remained stable since 2002, with the exception of a slight decline in 2004 (4.4 million). The 2010 estimate is up 16 percent from 2004, but the rates of use have remained flat.
Ages 18-25
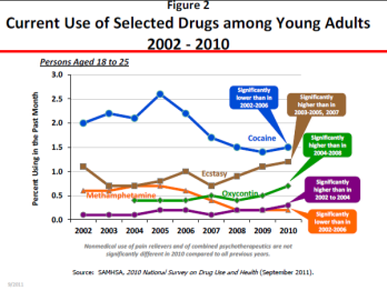
- Current use of OxyContin® (0.7 percent) was unchanged from 2009 but up from 0.4 percent in 2008 (figure 2).
- Current use of tranquilizers (0.7 percent) was unchanged from 2009 but up from 0.6 percent in 2008.
College students: Current nonmedical use of prescription drugs dropped from 6.3 percent in 2009 to 5.0 percent in 2010 among fulltime college students. Similarly, current non-medical use of pain relievers dropped from 4.5 percent to 3.2 percent.
Initiation: In 2010, about one-quarter (26 percent) of first-time drug users began with nonmedical use of prescription drugs.
- The number of past-year initiates of the non-medical use of pain relievers (2.0 million) in 2010 was 18 percent lower than the number in 2003 (2.5 million).
Marijuana
- Ages 12 and older: Of the 22.6 million Americans aged 12 or older who were current (past month) users of illicit drugs in 2010, 17.4 million (77 percent) were current marijuana users, making it the most commonly used illicit drug. In 2010, 6.9 percent of the population were current users of marijuana, unchanged from the 2009 estimate of 6.6 percent. This represents a 13-percent increase over 2008 (6.1 percent).
- Ages 12-17: Although there was no significant one-year change, the rate of current use rose significantly from 6.7 percent in 2008 to 7.4 percent in 2010 (figure 3).
- Ages 18-25: Rates of current use in 2010 (18.5 percent) were unchanged from 2009 but up from 16.5 percent in 2008 (figure 3).
- Ages 26 or older: Rates of current use in 2010 (4.8 percent) are unchanged from 2009 but rose from 4.2 percent in 2008 (figure 3).
- Initiation. The number of past-year marijuana initiates in 2010 was 2.4 million, unchanged since 2009. Nearly two-thirds (62 percent) of first-time drug users in 2010 began with marijuana.
Attitudes
-
The perceived risk of using marijuana once or twice a week declined (worsened) among youth between 2009 and 2010, dropping from 49.3
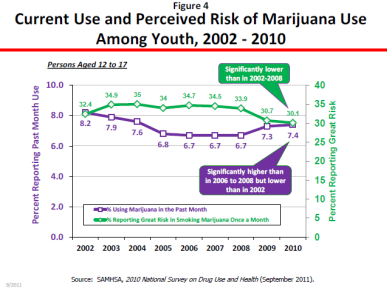 percent to 47.5 percent. Rates among those reporting great risk in smoking the drug once a month were significantly lower (worse) in 2010 than in 2002-2008 (figure 4).
Possible Reasons
- Pro-drug messages in the media and popular culture may misinform youth about a drug whose potency has tripled in the past 20 years and sends more youth to treatment than any other drug.
Cocaine
- Ages 12 and older: The number of current users in 2010 (1.5 million) was the lowest since 2002 and down 39 percent since the peak of 2.4 million in 2006 (figure 5).
- Ages 12-17: Current use was down significantly from 2008, from 0.4 percent to 0.2 percent.
- Ages 26 and older: Current use in 2010 (0.5 percent) declined from 2008 (0.7 percent).
-
Initiation: The number of past-year cocaine initiates in 2010 (637,000) was down 35 percent from 2006 (977,000).

- Perceived availability: The perceived availability of cocaine and crack cocaine decreased (improved) between 2009 and 2010, from 20.9 percent to 19.0 percent.
- Dependency or abuse: The number of people with a dependency or abuse problem with cocaine in 2010 (1.0 million) was unchanged from 2009 (1.1 million) but down 40 percent since 2006 (1.7 million).
Other Drugs
- Heroin: The mean age of first use among those aged 12-49 dropped from 25.5 years in 2009 to 21.3 years in 2010.
- Methamphetamine: The rate of current use among persons age 12 and older in 2010 was significantly lower than rates in 2002-2006 (from 0.3 percent to 0.1 percent).
Teen Use by Gender and Race/Ethnic Group
-
Among youth, current use of any illicit drug increased between 2008 and 2010 for Hispanic males (from 9.2 percent to 13.2 percent) and black females (from 7.3 percent to 10.4 percent) – increases of 43 percent and 42 percent, respectively (figure 6).

Parenting and Drug Use
In 2010, past-month use of illicit drugs and cigarettes, and binge alcohol use were lower among youths age 12-17 who reported their parents “always” or “sometimes” engaged in monitoring behaviors than among youths whose parents “seldom” or “never” engaged in such behaviors.
Administration Strategy
The Obama Administration’s National Drug Control Strategy (Strategy) calls for a balanced approach of prevention, treatment, law enforcement, interdiction, and international partnerships to achieve a 15-percent reduction in youth drug use over 5 years, as well as similar reductions in chronic drug use and drug-related consequences, such as drug-induced deaths and drugged driving.
The Strategy describes specific actions that Federal departments and agencies are taking to achieve the Administration’s two main drug control goals:
- Curtailing illicit drug consumption in America, and
- Reducing the consequences of drug abuse that threaten our public health and safety.
It also highlights the development and implementation of evidence-based prevention and intervention practices and policies supported by Federal partnerships with state, local, and tribal jurisdictions and other stakeholders.
We will continue working with communities across the Nation to implement this Strategy and ensure continuity, accountability, and transparency in the Administration’s efforts to reduce drug use and its consequences.
Download PDF