Average Absence Rates
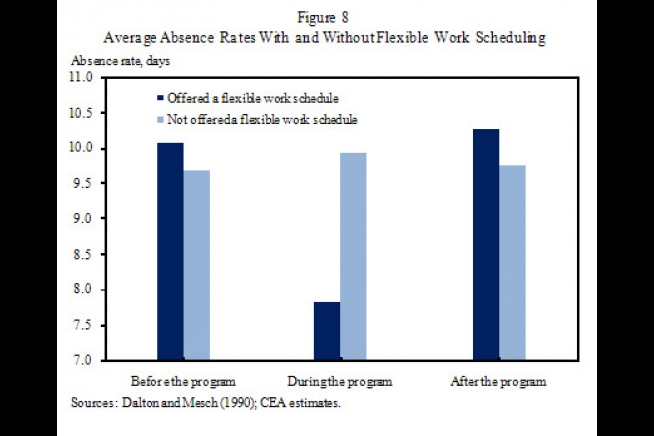
Figure 8 shows the average absence rate for employees in two subunits of a public utility company before, during, and after a flexible work schedule program was implemented. Workers in one subunit of the company were offered a flexible work schedule for a year, while workers in another subunit were not. Prior to the implementation of the flexible work program, as well as in the years after the program ended, both groups had similar absence rates. For those workers not offered a flexible work schedule, their absence rate was roughly constant over the period considered. The absence rate for employees in the subunit that was offered flexible scheduling, however, fell dramatically during the year of the implementation of the program. Download this data as a CSV file.