
Promoting Clean, Renewable Energy: Investments in Wind and Solar
Home | Executive Summary | Introduction | Transportation | Renewable Energy | Private Sector | Medical Research
Three decades ago, the U.S. led the world in the development of renewable energy, such as wind, solar, and geothermal power. Since then, markets for renewable energy have grown predominantly overseas due to strong, consistent foreign government incentives and policies. As a result, manufacturing of renewable energy equipment has grown largely overseas as well. Recovery Act investments are helping the U.S. re-establish leadership in innovation, manufacturing, and deployment in these fast-growing industries, which will create new jobs, increase access to clean energy, and reduce greenhouse gas emissions.
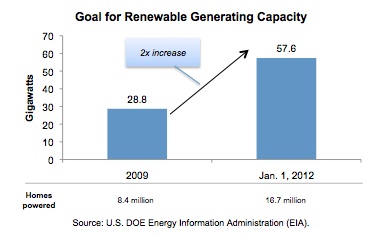
In the beginning of his Administration, President Obama set a goal of doubling U.S. renewable energy generation capacity from wind, solar, and geothermal by 2012. This was a bold goal – to install as much renewables in the next three years as the U.S. had in the previous thirty. In addition, President Obama set the goal of doubling U.S. renewable manufacturing capacity, so that the U.S. can gain leadership in manufacturing these technologies as well.
Specifically, the goals are to double renewable energy capacity from the 28.8 gigawatts (GW) of solar, wind, and geothermal generation that had been installed in the U.S. as of the end of 2008 to 57.6 GW by the end of 2011 18 – enough to power 16.7 million homes 19 – and to double renewable energy manufacturing capacity from an annual output of 6 GW of renewable equipment (such as wind turbines and solar panels) at the end of 2008 to 12 GW by the end of 2011.

Since 2009, growth in renewable energy has increased, and the U.S. is making significant progress toward meeting both goals, due in large part to support from the Recovery Act. This has happened despite the sharp economic and financial downturn over this period. Without Recovery Act investments, it is likely that the pace of renewable energy project construction and manufacturing growth would have slowed dramatically, and these goals would have been much more difficult to meet.
Not only are these investments in renewable energy projects helping to create tens of thousands of jobs in construction and manufacturing, but they also could help renewable energy technologies achieve economies of scale and bring down costs. Other Recovery Act investments are funding a diverse set of research projects to develop next generation renewable energy technologies, such as solar thin films and new wind turbine designs. These research projects could reduce the cost even further, to the point that electricity from renewable energy technologies could become cost competitive with electricity from coal or natural gas power plants.
There are three key programs through which the Recovery Act is driving manufacturing and deployment of renewable energy technologies:
Payment-in-Lieu-Of-Tax-Credits (1603)
- Over $3 billion so far in payments-in-lieu-of-tax -credits to over 500 projects in 44 states to support renewable energy generation projects
- Supports more than 10,000 construction jobs and over 2,000 ongoing operating and maintenance jobs
- Brings more than 4 GW of new renewable energy online
- Leverages $2 of private capital for every $1 of tax credits
Manufacturing Tax Credits (48C)
- Over $2 billion in tax credits to 183 projects in 43 states for clean energy manufacturing projects
- 30 percent tax credit for qualifying advanced energy projects in new, expanded, or re-equipped domestic manufacturing facilities
- Competition was more than 3x oversubscribed
- Leverages $2 of private capital for every $1 of tax credits
Loan Guarentees
- $2 billion in conditional or closed loan guarantees for renewables deployment and manufacturing projects
- Projects will create or save more than 5,000 construction and permanent jobs, lead to more than 3 GW of clean power generating capacity, and avoid more than 30 million tons of CO2 per year, according to company estimates.
- Leverages more than $4 of debt and equity for every $1 of loan guarantee subsidy
Solar Power: Manufacturing and Deploying Today's Technologies
Today, solar power is significantly more expensive than electricity from fossil fuels in most regions of the country. All the solar power in the country generates less than one percent of the nation’s electricity. The Recovery Act is helping to deploy the latest generation of solar power technologies more rapidly while also expanding manufacturing of solar technologies here in the U.S. This is helping to increase U.S. solar generating capacity while simultaneously scaling up manufacturing and driving down costs.
- The 1603 Payments-In-Lieu-Of-Tax-Credits program has supported more than 200 megawatts (MW) of solar projects that are already delivering solar power to consumers. These projects are deploying solar panels that generate affordable green power on the rooftops of thousands of homes across the country and in the fields of some of the largest industrial-sized solar generating facilities in the world. For example, in Pensacola, Florida, the program has helped fund the 25 MW DeSoto Solar Park, the largest photovoltaic power plant in North America, which consists of over 90,000 solar panels and provides enough solar power to serve about 3,000 homes. 20
- The 48C Manufacturing Tax Credits are helping solar manufacturers like FirstSolar, which is expanding a large manufacturing plant in Perrysburg, Ohio, and Sunpower, which is expanding its manufacturing in Milpitas, California. Both companies had received earlier Department of Energy research and development grants to help develop the technologies that are now being brought to commercial scale.
- Loan guarantees are helping Solyndra in Fremont, California, build a high-tech, solar panel manufacturing facility with the capacity to build 230 MW a year. The Department of Energy also has issued conditional commitments for BrightSource Energy to build a 377 MW solar power plant in Ivanpah, California. Together, Solyndra and BrightSource estimate that these projects will lead to over 4,000 construction jobs and over 1,000 ongoing manufacturing and operations jobs.21
These solar deployments and factories create high-quality jobs today and promise to help re-establish U.S. leadership, reversing years of declining U.S. market share in global solar production. Domestic manufacturing capacity for solar photovoltaic (PV) modules – the panels that convert sunlight into electricity – is forecast to grow from less than one GW per year in 2008 to nearly four GW per year in 2012.21 The U.S. share of global manufacturing capacity is expected to grow from over eight percent in 2008 to over 14 percent in 2012.23

Solar Power: Investing in Tomorrow’s Technologies
The Recovery Act is accelerating the rate of innovation in solar photovoltaics (PV), by more rapidly deploying today’s technologies and by funding a competition among new solar technologies in laboratories and start-ups pursuing tomorrow’s breakthroughs. While companies like Sunpower continue to improve and perfect the standard silicon solar panel, companies like FirstSolar and Solyndra are scaling up production of new thin-film chemistries like cadmium telluride (Cd-Te) and copper indium gallium selenide (CIGS). This could help drive down the costs of solar panels by half between 2009 and 2015.
The Department of Energy’s solar PV incubator program is continuing to support competition among crystalline silicon, thin-film materials like Cd-Te and CIGS, and concentrating PV. Companies like AltaDevices, SolarJunction, and Semprius are applying novel new technologies to increase the efficiency and lower the cost of solar. In addition, the Department of Energy’s Recovery Act pre-incubator and incubator programs are supporting breakthroughs in nanomaterials and organic materials that could drive down costs even further.
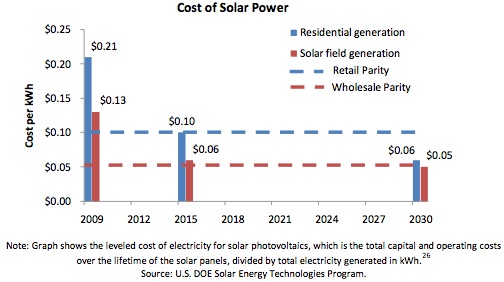
If such projects are successful, the cost of solar power could become cheaper than electricity from the grid. Together, these deployment and research and development programs are working towards the goal of bringing down the cost of solar by half over the next five years, from roughly $0.20/kWh to $0.10/kWh for solar electricity generated at residences. 24 If breakthroughs in technology can bring costs down to $0.06/kWh by 2030, solar power will be cheaper than retail electricity from the grid, even without government incentives. At that cost, an average household with rooftop solar panels could save more than $400 each year in electricity bills. 25
The cost of solar is forecast to reach grid parity over the next five years in many parts of the country. 25 This means homeowners (who pay an average retail cost of about 10 cents/kWh for electricity from the grid) and utility companies (which have average wholesale power costs closer to 5 cents/kWh) can use solar power without paying a premium over fossil-based electricity.
Near-term improvements will be able to cut the cost of solar power in half, as second generation thin-film solar panels such as the rapidly emerging CIGS and Cd-Te technologies compete with ever improving traditional silicon-based panels. Beyond that, breakthrough technologies could make solar as cheap as new fossil fuel plants without government incentives.
Wind Power: Manufacturing and Deploying Today’s Technologies
Wind is among the most mature of renewable energy technologies and is currently the U.S.’s largest source of renewable power, excluding hydropower, and accounts for nearly two percent of the nation’s total electric generation. 28 U.S. wind power capacity was 35 GW as of the end of 2009, which was nearly a 40 percent increase from the year before. For the fifth straight year, wind power was second only to natural gas in new electricity generation capacity added.
Over the last 30 years, the cost of wind power in the U.S. has come down by more than 80 percent, from over 30 cents/kWh in 1980, when the first large-scale wind turbines were installed, to less than 5 cents/kWh today, which is roughly competitive with fossil generation from new coal or natural gas plants. 29
The market for wind power, however, has grown primarily overseas due to strong, consistent foreign government incentives and policies. In the U.S., support for the Production Tax Credit (PTC) has been uncertain and unstable, disrupting domestic wind development. As a result, wind manufacturing, too, has grown largely overseas. Just in the last few years, thanks in large part to consistent U.S. policy support, the U.S. market for wind power has begun to grow dramatically and in response to that growth, more wind turbine manufacturing has located in the U.S.

The Recovery Act is helping to ramp up manufacturing and deployment of wind power components in the U.S., maintaining strong demand and financing for wind projects and helping to attract billions of dollars of additional investment into U.S. wind manufacturing.
In January of 2009 there was 25 GW of wind energy installed in the U.S. After a few years of strong growth, including 8.5 GW installed in 2008, the wind industry expected a substantial drop in 2009 due to the effects of the economic and financial markets downturn; predictions hovered around five GW of new installations for the year. 30 Instead, the U.S. wind industry broke all previous records by installing over ten GW of new generating capacity in 2009, helped greatly by Recovery Act incentives. 31
Two analyses – by Lawrence Berkeley National Laboratory 32 and by Bloomberg New Energy Finance – indicate that, without the Recovery Act’s incentives, wind installations in 2009 could have been 2 GW to 2.4 GW lower. The Council of Economic Advisers in their July 2010 Fourth Quarterly Report find that the Recovery Act was responsible for approximately 6 GW of wind capacity installation that might not otherwise have occurred. 33

A good portion of the wind installation that comes online in 2010 and beyond will be supported by Recovery Act funding invested in 2009 and 2010. Wind capacity is now expected to grow to over 52.5 GW by the end of 2011. If these projections are met, the U.S. will come close to meeting its goal of doubling renewables in three years through investments in wind alone, and growth in solar and geothermal could take us well beyond the goal.
The 1603 program has provided over $3 billion in payments-in-lieu-of-tax-credits to more than 100 wind projects in 30 states around the country, totaling 5.3 GW of wind power capacity. The program has directly addressed the freeze in tax equity markets related to the financial crisis, enabling projects to close financing and begin construction again. Since the beginning of the program in the summer of 2009, the U.S. has seen a dramatic increase in clean renewable energy project development despite industry predictions of a sharp slow-down in the face of a challenging economic environment. 34
According to the renewables industry consulting firm MAKE Consulting, U.S. manufacturing capacity to produce the various components wind turbine components is uneven; the manufacturing capacity for certain components such as gearboxes, generators, and large casted steel parts, lags behind U.S. demand for those components.
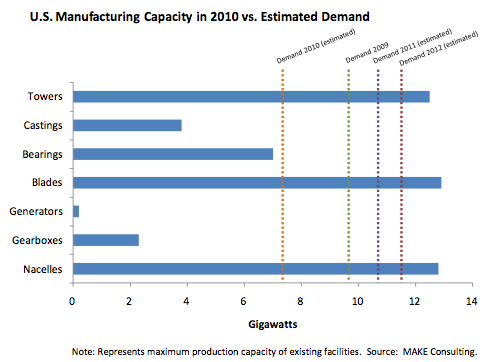
The 48C Manufacturing Tax Credit program has awarded $346 million in tax credits to 52 wind manufacturing projects across the country. These new facilities, when built and fully online, will add several gigawatts per year of additional U.S. manufacturing capacity for wind components such as towers, blades, gearboxes, and generators to ensure the U.S. is able to supply a growing domestic market through domestic production. For example, these tax credits will support companies such as Alstom, Brevini Wind, Siemens, and Vela Gear Systems in building or expanding several manufacturing plants that will greatly increase the U.S. supply of gearboxes, one of the components that is currently in short supply domestically.
Wind Power: Investing in Tomorrow’s Technologies
Currently the U.S. does not have facilities that are able to fully test the next generation of large wind turbines and blades, putting U.S. wind manufacturers at a competitive disadvantage. The Recovery Act is funding two large wind turbine R&D test centers – one for turbines and one for blades – that will allow development and testing of the next generation of large-scale wind turbine drive-train systems and blades here in the U.S. This will help enhance the performance, durability, and reliability of U.S.-manufactured wind turbines and blades.
Wind turbine sizes have increased with each new generation of turbines and have outgrown the capacity of existing U.S. drive-train testing facilities. The new testing capability will ultimately improve U.S. competitiveness in wind energy technology, lower energy costs for consumers, and maintain rapid growth in the deployment of wind energy systems.
- Massachusetts’ Large Blade Test Facility (Recovery Act award of up to $25 million): The Testing Center in Charlestown, Massachusetts will allow the U.S. wind industry to test and certify the performance of the latest generation of very large wind turbine blades. The Test Center will primarily provide certification tests for new blade designs and reliability testing for existing blade designs for wind turbine manufacturers.
- Clemson University’s Large Drive Train Test Facility (Recovery Act award of up to $45 million): The Large Wind Turbine Drive Train Test Facility will enable the U.S. to expand development and testing of large-scale wind turbine drive-train systems domestically. The new testing capability will ultimately improve U.S. competitiveness in wind energy technology.
Even with a more mature technology like wind, there is still the potential for breakthroughs that can dramatically improve performance, reduce cost, and give U.S. manufacturers a competitive lead. ARPA-E has invested in two potentially game-changing wind turbine technologies:
- PAX Streamline Inc.’s Adaptive Turbine Blades (Recovery Act award of up to $3 million): PAX Streamline is developing a prototype “blown wing” wind turbine at the 100 kW scale. Unlike typical wind turbine blades, which have fixed airfoils, a “blown wing” turbine blade can be dynamically adjusted to maximize power under a wide range of wind conditions. Blown wing technology has been demonstrated on aircraft by the U.S. military, but it has not yet been demonstrated for wind turbines.
- FloDesign Wind Turbine Corp.’s Shrouded Wind Turbines (Recovery Act award of up to $8.3 million): FloDesign is developing a novel shrouded (enclosed) wind turbine, analogous to jet turbine designs, which may deliver significantly more energy for its size than existing wind turbines.
18 Source for Jan. 1, 2009 baseline: U.S. Department of Energy, Energy Information Administration (EIA), “Annual Energy Outlook 2010.” While electricity generated from biomass is an important component of the renewable goals, it is not included in these figures.
19 Based on average annual household electricity consumption of 11,040 kWh in 2008. Source: U.S. EIA.
20 Florida Power & Light Company, “DeSoto next Generation Solar Energy Center,” http://www.fpl.com/environment/solar/desoto.shtml (accessed August 20, 2010).
21 Jobs estimates provided by Solyndra and BrightSource.
22 Shyam Mehta, “PV Manufacturing in the United States: Market Outlook, Incentives and Supply Chain Opportunities,” (GTM Research, September 2009), 39.
23 GTM Research and U.S. DOE Solar Energy Technologies Program estimates.
24 Cost estimates are in 2009 dollars and include the relevant Federal, but not state or local incentives.
25 Assumes a retail electricity rate of $0.097/kWh in 2030 and average household electricity consumption of 11,040 kWh/year. Source for electric rates: U.S. EIA, Annual Energy Outlook 2010. Source for household electricity consumption: U.S. EIA.
26 Grid parity would be reached after including federal, but not state or local, incentives. Source: U.S. DOE Solar Energy Technologies Program.
27 Includes federal 30 percent Investment Tax Credit until 2016 (when it is currently set to expire) but not thereafter.
28 Wind power provided 1.8 percent of total U.S. electricity generation in 2009. This is an increase from 1.3 percent of generation at the end of 2008. Source: U.S. DOE, Energy Information Administration (EIA).
29 Cost estimate is for the latest generation of large wind turbines at windy sites in the U.S. and includes the federal Production Tax Credit. Source: U.S. DOE Wind and Water Power Program.
30 American Wind Energy Association, “AWEA Year End 2009 Market Report” (January 2010), http://www.awea.org/publications/reports/4Q09.pdf.
31 American Wind Energy Association, “AWEA Year End 2009 Market Report” (January 2010), http://www.awea.org/publications/reports/4Q09.pdf and American Wind Energy Association, “Wind Power Outlook 2009,” http://www.awea.org/pubs/documents/Outlook_2009.pdf.
32 Bolinger, Mark, Ryan Wiser, and NaÏm Darghouth, “Preliminary Evaluation of the Impact of the Section 1603 Treasury Grant Program on Renewable Energy Deployment in 2009,” Lawrence Berkeley National Laboratory (April 2010).
33 Council of Economic Advisers, Executive Office of the President, “The Economic Impact of the American Recovery and Reinvestment Act of 2009, Fourth Quarterly Report,” (July 14, 2010), 44, http://obamawhitehouse.archives.gov/files/documents/cea_4th_arra_report.pdf (accessed August 20, 2010).
34 In 2008, wind installations increased by an even larger rate (50 percent with 8,545 MW added) than they did in 2007 (45 percent, with 5,249 MW added), bumping up wind power’s five-year average annual growth rate (2004- 2008) to 32 percent. The previous five-year average annual growth rate (2003-2007) was 29 percent.