
Modernizing Transportation: Investments in Advanced Vehicle Technology and High Speed Rail
Home | Executive Summary | Introduction | Transportation | Renewable Energy | Private Sector | Medical Research
Oil powers 95 percent of America’s cars, trucks, ships, planes, and rail cars. Moreover, the United States is the largest oil consumer and importer in the world and relies on imports for more than half of its oil onsumption. 6 This dependence on oil is an energy security threat and increases U.S. economic vulnerability. The environmental impact of petroleum-powered vehicles is also a rising concern. Nevertheless, most Americans cannot afford or access alternatives to petroleum.
Today, an American driving 32 miles a day to and from work 7 will spend almost $1,000 a year on gasoline, each day adding to U.S. dependence on foreign oil. 8 A consumer driving an electric car would save over $630 per year powering the car with electricity generated in American power plants instead of gasoline made from imported oil. 9 The only highway-enabled electric vehicle option available today, however, would cost more than $100,000.
Americans driving longer than a normal commute, such as from Chicago to St. Louis, would face further difficulties. With today’s technology, an electric vehicle could not make this 300-mile drive on a single charge. In addition one would not be able to easily recharge an electric vehicle en route since the closest charging station is in Champaign, Illinois, 136 miles from Chicago. If instead one wanted to make this trip via train, it would take five and a half hours and cost from up to $66 thus saving neither time nor money compared to driving a combustion vehicle.
The Recovery Act directly tackles such issues with a multi-pronged approach -- investing in technologies that will make alternatively powered vehicles cheaper, technologies that will make an alternative energy vehicle reality structurally feasible, and a high-speed rail network that will reduce travel time.
Advanced Vehicles: Manufacturing and Deploying Today’s Technologies
The Recovery Act is helping transform the U.S. automotive sector by investing in a competition among various approaches: electric vehicles, advanced biofuels, natural gas vehicles, hydrogen fuel cells, and more efficient combustion vehicles. Each of these approaches, which include a range of technologies, shows promise to be a significant improvement over current technology. Ultimately, the market will be able to choose different combinations of these technologies. 10 This section will highlight Recovery Act investments in one of these important areas of innovation: electric-drive vehicles.
The Recovery Act and the Advanced Technology Vehicles Manufacturing (ATVM) loan program are investing across the innovation chain – from retooling current auto factories to new manufacturing and commercial deployment to research and development in electric drives and batteries. With these investments, the U.S. is taking significant steps toward affordable electric cars that can drive 300 miles on a single charge, powered by $10 of clean electricity instead of $50 dollars of oil. Ultimately this means consumers may have the choice among a range of vehicles from a combustion vehicle with over 50 miles per gallon or an electric-drive vehicle for the same price.
Electric cars need batteries and drive components that are in short supply in the U.S. To stimulate their production, over $2 billion in Recovery Act funding is being invested in companies like A123 and EnerDel, supporting 30 factories to produce the advanced batteries and electric drive components necessary to power the electric-drive vehicles of the future. In 2009, the U.S. had only two factories manufacturing advanced vehicle batteries and produced less than two percent of the world’s advanced vehicle batteries. 11 By 2012, thanks in part to the Recovery Act, the 30 factories mentioned above will be online. By 2015, when these factories reach scale, they will have the capacity to produce enough batteries and components to support up to 500,000 plug-in hybrid electric vehicles. From a negligible portion of the world’s advanced battery manufacturing today, U.S. production capacity for advanced vehicle batteries will amount to more than 20 percent of global production capacity estimated to be online in 2012. 12 Similarly, the Recovery Act is helping to scale production of electric-drive components such as motors and conductors. Companies like UQM, which has long-built only custom prototype parts, are expanding manufacturing capacity to build electric power trains at high volume.

Source: U.S. DOE Vehicle Technologies Program.
Click here to download CSV
In addition, the Department of Energy is directing a large amount of funding outside the Recovery Act to increase U.S. manufacturing capability. Over $2.4 billion in Advanced Technology Vehicle Manufacturing (ATVM) loans to Fisker, Nissan, and Tesla are supporting three of the world’s first electric car factories in Delaware, Tennessee, and California, respectively. 13 In fact the Nissan Leaf, an affordable and 100 percent electric vehicle with a range of roughly 100 miles on a single charge, is expected to hit the U.S. market at the end of 2010 and will be manufactured in Tennessee beginning in 2012.
This means American workers will soon be working in some of the most cutting edge and competitive factories in the world, including more than 2,000 jobs at Fisker’s factory in Delaware, 1,300 new jobs at Nissan’s factory in Tennessee, and more than 1,000 jobs at Tesla’s factory in southern California. 14 It also means several thousand jobs in Michigan and all over the country at new battery and component factories like East Penn Manufacturing, Celgard, and Delphi Automotive Industries.
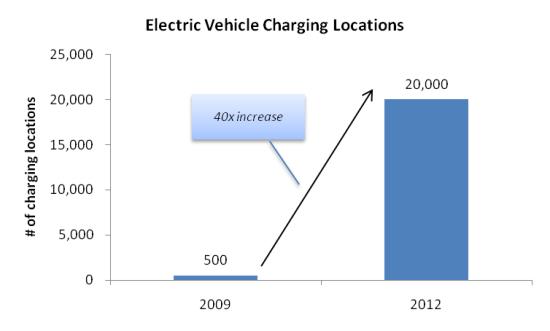
Beyond manufacturing, another $400 million from the Transportation Electrification program is supporting electric vehicle deployment programs. Companies like ETEC in Phoenix, Arizona will move the U.S. from less than 500 electric vehicle charging locations today to over 20,000 by 2012. These programs are also helping put the first 13,000 electric vehicles on the road, in more than a dozen cities. Recovery Act electric vehicle demonstration projects will show how electric cars perform under real driving, traffic, and weather conditions.
Source: U.S. DOE Vehicle Technologies Program.
Click here to download CSV
Advanced Vehicles: Investing in Tomorrow’s Technologies
While battery factories and electric vehicle deployments are helping roll out the latest generation of technologies available today, the Recovery Act is also helping develop breakthrough technologies that will keep the U.S. auto sector globally competitive in the future. The Recovery Act is supporting a broad set of technologies to help make electric drive a reality, each with the potential to dramatically lower costs and improve battery performance.
When the Recovery Act passed, battery technology was a key barrier to the widespread use of electric cars: batteries were too costly, too heavy, and too bulky, and would wear out too quickly. The high cost of electric cars resulted mostly from the high cost of the batteries. Between 2009 and 2013, when 20 Recovery-Act funded battery factories will be up and running and these factories begin to achieve economies of scale, battery costs are expected to drop by half, thereby cutting an electric car’s cost premium in half. Fisker, GM, Nissan, Tesla, and other automakers have plans to introduce more affordable electric vehicles. Drivers will be able to save money over a car’s lifetime because electricity is significantly cheaper than gasoline.
The Recovery Act is also funding a set of breakthrough research projects. The Department of Energy’s Advanced Research Projects Agency (ARPA-E) program is supporting potential game-changers like semi-solid flow batteries, ultracapacitors, and “all-electron” batteries that could go well beyond today’s best lithium-ion technologies. ARPA-E funding is allowing startups like Envia, Electroville, Sion Power, and FastCAP to pursue these innovations that otherwise would not have been able to proceed as quickly. If successful, these breakthroughs could cut battery costs by as much as 90 percent and expand range three to six-fold, bringing the up-front cost of electric cars down to that of gas cars and giving them a longer range. This means the savings would begin as soon as the electric vehicles are driven out of the showroom and one would be able to fill up at home at night rather than having to stop by the gas station during the commute.

Note: Assumes 3 miles per kilowatt hour and 100-mile range. Source: U.S. DOE Vehicle Technologies Program.
Click here to download CSV
The Recovery Act is supporting innovations to improve battery performance and reduce weight. In 2009, heavy batteries limited a vehicle’s range and acceleration. Low cycle-life also meant batteries might wear out in just a few years. Recovery-Act supported projects are making batteries denser. These smaller, lighter batteries mean more power, improved performance, and greater range.

Batteries are also becoming more durable, and in the next few years domestic manufacturers should be able to produce batteries that last up to 14 years. This should give consumers confidence that electric vehicle batteries will last the full life of the vehicle. In addition, longer lasting batteries reduce the potential for used batteries to become waste material. 15

Investments in High-Speed Rail
Along with investments in vehicle technology, the Recovery Act is investing in world-class public transportation options. With less than 500 miles of high-speed rail with speeds far slower than other countries, the U.S. is significantly behind other nations. China has already completed nearly two-thirds of a planned 8,000-mile high-speed rail network; and geographically smaller countries like Japan, France, and Germany all have over 1,000-mile networks.
While the overall population density of the U.S. is lower than much of Europe and Asia, there are major metropolitan corridors stretching from 100 and 600 miles that are comparable to corridors around the world where high-speed rail has proven to be a successful addition to transportation networks. In the U.S., several economically interdependent metropolitan regions that face growing highway and aviation congestion are strong candidates for future high-speed rail investment. These including the Midwest hub, the Pacific Northwest, California, Texas and the Gulf, Florida, and the Southeast and Northeast corridors. The Federal Railroad Administration is employing rigorous planning and cost-effectiveness analysis to ensure Federal investments are targeted at those projects that maximize benefits to transportation systems and overall economic performance.
With $8 billion in funding, the Recovery Act is beginning to make high-speed rail a reality across the country. The initial projects selected to receive funding represent strategic investments that will ultimately result in new high-speed rail corridors and will upgrade thousands of miles of existing track and services, laying the groundwork for future high-speed rail services.

California’s high-speed rail mega-project promises to alter significantly the transportation landscape in California by connecting the State’s largest metropolises with up to 220-mph service. Once complete, California anticipates business, leisure, and commuter ridership of up to 100 million passengers a year by 2035, which if realized, would make it one of the busiest passenger rail lines in the world. On August 11, 2010, the Transbay Transit Center in San Francisco, the northern terminus for the California high-speed rail system, broke ground. Touted as the “Grand Central of the West,” it is the first new station on the California high-speed rail system to move into construction. It is expected to serve more than 45 million passengers a year. 16
In other parts of the country, Recovery Act investments are laying the groundwork for important improvements to the Nation’s intercity passenger rail network. The direct benefits from just five corridors 17 funded under the Recovery Act’s high-speed rail program include:
- 808 route miles of track improvements or new high-speed rail track with 364 route miles operating at speeds of up to 110 mph and 84 route miles operating at speeds of up to 168 mph;
- 95 percent increase in U.S. high-speed rail route miles versus current Acela service;
- 26 new or additional round trip service frequencies; and
- 18 percent better trip times, saving an estimated 3.8 million hours for travelers annually.
With Recovery Act funding, the train ride from Chicago to St. Louis referenced earlier will be reduced from five and a half hours to around four hours, a drop of nearly 20 percent. This investment can help build the market for future express high-speed rail service of two hours for that route, with significantly increased speeds of up to 220 mph.

Source: Amtrak timetable for “Lincoln Service” route [existing service]; Illinois Department of Transportation application to the High-Speed Intercity Passenger Rail program, “IL-Dwight-St.Louis-2004 ROD Improvement,” October 4, 2009 [improved service]; Midwest High-Speed Rail Association, “Chicago to St. Louis 220 mph High Speed Rail Alternative Corridor Study,” October 8, 2009 [long-term vision].
Click here to download CSV
6. U.S. Energy Information Administration (EIA). In 2008, net imports represented 56 percent of U.S. petroleum consumption and 67 percent of oil crude oil consumption. U.S. net imports: http://www.eia.doe.gov/dnav/pet/hist/LeafHandler.ashx?n=pet&s=mttntus2&f=a (accessed August 20, 2010)
US oil consumption: http://www.eia.doe.gov/dnav/pet/hist/LeafHandler.ashx?n=PET&s=MTTUPUS2&f=A (accessed August 20, 2010)
7. According to a 2005 ABC News/Time magazine/Washington Post poll, the average commute for Americans is 32 miles.
8. Assumes 32 miles a day, 5 days a week, a vehicle with a fuel economy of 27.5 miles per gallon (CAFÉ standard for 2010), and $3 a gallon gasoline.
9. Assumes 3 miles a kWh and $0.10 a kWh. This does not include the additional up-front cost of the electric vehicle.
10. The different approaches can also converge, for example with plug-in hybrid electric vehicles recharged by efficient combustion engines running on cellulosic biofuels.
11. In 2008, the U.S. produced less than two percent of the Nickel metal hydride batteries used in hybrid vehicles (www.nrel.gov/docs/fy09osti/46018.pdf, accessed August 20, 2010). U.S. production of lithium-ion batteries was virtually nothing
12. Percentage refers to capacity to produce lithium-ion cells intended for advanced vehicle batteries. U.S. production capacity estimated by the Department of Energy Vehicle Technologies Program, based on Recovery Act and ATVM battery factories. Global production capacity estimated by Deutsche Bank.
13. The Department of Energy’s ATVM Program was not created in the Recovery Act. The program, which announced its first loans in 2009, has been a critical part of the domestic auto industry’s efforts to lead the global race to produce advance vehicles.
14. ATVM job numbers are company estimates.
15. The Department of Energy is also actively coordinating industry efforts to develop a systematic standards and processes to recycle used batteries.
16. Transbay Transit Center, “Historic Groundbreaking of First New High-Speed Rail Station in United States,” (August 11, 2010), http://transbaycenter.org/uploads/2010/08/groundbreaking_press_release_2010-0811.pdf (accessed August 20, 2010).
17. (1) Charlotte – Raleigh, (2) Tampa – Orlando, (3) Chicago – St. Louis, (4) Milwaukee – Madison, and (5) Seattle – Portland