
The Final State of the Union
It is no secret that the last several months have seen dramatic progress in expanding access to high-quality, affordable health insurance. Over the Affordable Care Act’s first open enrollment period, more than 8 million people signed up for coverage through the Health Insurance Marketplaces, and, through March 2014, 4.8 million people gained coverage through Medicaid or CHIP. Meanwhile, multiple independent surveys have reported sharp drops in the share of Americans without health insurance.
What is not widely known is that the last several months have also seen a steady stream of good news on health care costs. This good news suggests that even as coverage expands, the underlying slow growth in health care prices, per-enrollee spending, and premiums that we have seen in recent years is continuing. That slow cost growth, which is thanks in part to the Affordable Care Act, is helping keep families’ premiums and out-of-pocket costs down, making it easier for businesses to hire workers and pay a good wage, and improving our fiscal future.
The health care costs faced by any particular family or business should not be confused with total national health care spending. The Affordable Care Act was designed to expand health insurance coverage—and access to health care services—for millions of people, and expanded coverage appears to have driven an increase in total health spending during the first quarter of this year, according to preliminary data on consumer spending from the Bureau of Economic Analysis. It is not a surprise to see a one-time increase in total spending as millions of people gain health insurance. It is also not a problem; the additional health care spending is good for the newly insured, good for doctors and hospitals, and good for our economy at a time when unemployment is still elevated.
And, crucially, even if total national health spending increases because more people have affordable coverage and can go to the doctor when they need to, that does not mean that people who had coverage before are seeing higher costs as a result. What matters for those who are continuously insured are the prices and premiums they face. As documented in this blog post, these prices and premiums are continuing to rise at unusually slow rates, a fact that provides an important backdrop for the beginning of the month-long application period for qualified health plans in the Health Insurance Marketplace.
Growth of Health Care Prices Continues to be the Slowest in Decades
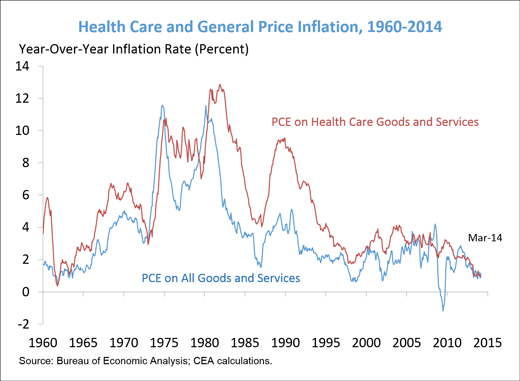
Perhaps the most striking evidence from the last few months that underlying trend in health costs remains favorable is the continued slow growth in the prices of health care goods and services. As measured using data from the Bureau of Economic Analysis through March 2014, prices of health care goods and services were up just 0.9 percent relative to a year ago, the slowest rate of increase in the last 50 years. The slow growth in health prices does not merely reflect slow inflation economy-wide, as the gap between health care inflation and general inflation is also low in historical terms. (A portion of the slow growth in health care prices over the last year does reflect the initiation of sequestration in the spring of 2013; sequestration will not have the same dampening effect on price growth going forward as it did over its first year. Nonetheless, health care price inflation reached levels not seen since 1963 even before sequestration began last spring.)
Preliminary Data Show Slow Private-Sector Cost Growth in Late 2013 and Early 2014
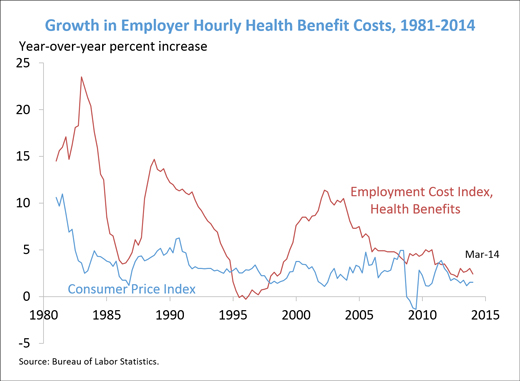
Families’ health care spending depends not only on the prices of health care goods and services, but also on the amount of health care they receive, and it is total spending that is taken into account when determining the amount they (or their employer) pay in premiums.
While authoritative data on per-enrollee health care spending and health insurance premiums in 2014 will not be available for some time, recent data show that these measures of costs have continued to grow at unusually slow rates through late 2013 and into 2014:
Note that the growth rates reported above are not adjusted for inflation.
Medicare Spending Is Continuing to Grow Slowly
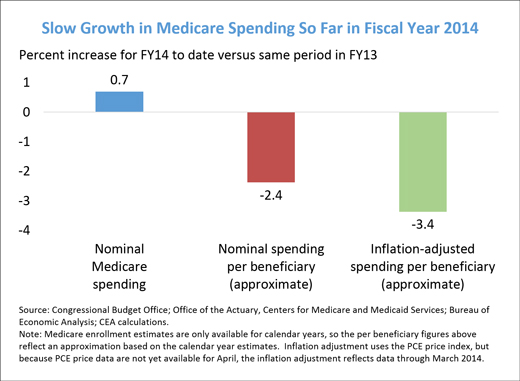
Continued slow growth in spending per enrollee is not limited to private insurance. Through the first seven months of fiscal year 2014, Medicare spending is up just 0.7 percent relative to the same period in fiscal year 2013 (after adjusting for timing shifts), according to the Congressional Budget Office. This is despite the fact that Medicare enrollment is projected to grow by more than 3 percent in 2014 as more Baby Boomers become eligible for Medicare. Adjusting for this increase in enrollment and for general inflation, inflation-adjusted Medicare spending per beneficiary is actually down 3.4 percent so far this fiscal year relative to the same period last fiscal year. This fall follows three (calendar) years over which growth in inflation-adjusted Medicare spending per beneficiary is estimated to have averaged close to zero.
Conclusion
In sum, 2014 is shaping up to be a year of continued success in keeping the underlying growth in health care costs low, alongside historic progress in expanding health insurance coverage to millions more Americans. We will be working to build on those achievements as issuers submit their premiums for review and approval for sale through the Marketplace for 2015 and as we continue to implement the Affordable Care Act.

