

The Final State of the Union
A new report this week from the Centers for Medicare and Medicaid Services had a lot to say about the state of health care costs and what it means for our economy. New estimates show that national health expenditures rose at historically slow rates in 2013 and American businesses and consumers will continue to see slow cost growth over the next few years, even as millions gain health insurance coverage under the Affordable Care Act.
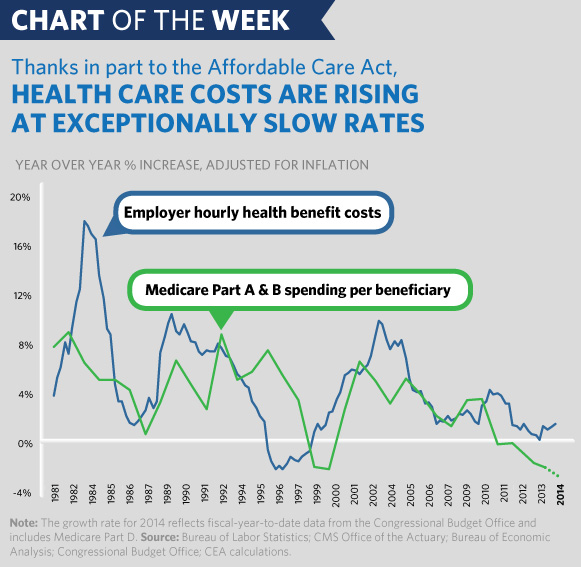
This week’s Chart of the Week uses the most up-to-date data to break down what’s going on with health care costs for employers and the Medicare program. Right now, employers’ inflation-adjusted health benefit costs are up just 1 percent on a year-over-year basis, among the lowest rates recorded historically. This slow growth in employer health costs helps businesses create jobs and pay a good wage. At the same time, Medicare spending per beneficiary is actually falling in inflation-adjusted terms, which is helping keep premiums low for beneficiaries and bringing down our deficit.
Take a look at the numbers to see how health care costs for employers and the Medicare program are at near-historic lows:
Get the full story behind these health care numbers from Jason Furman, Chairman of the Council of Economic Advisers -- then check out what people are saying about why it’s so important to #GetCovered.

