

The Final State of the Union
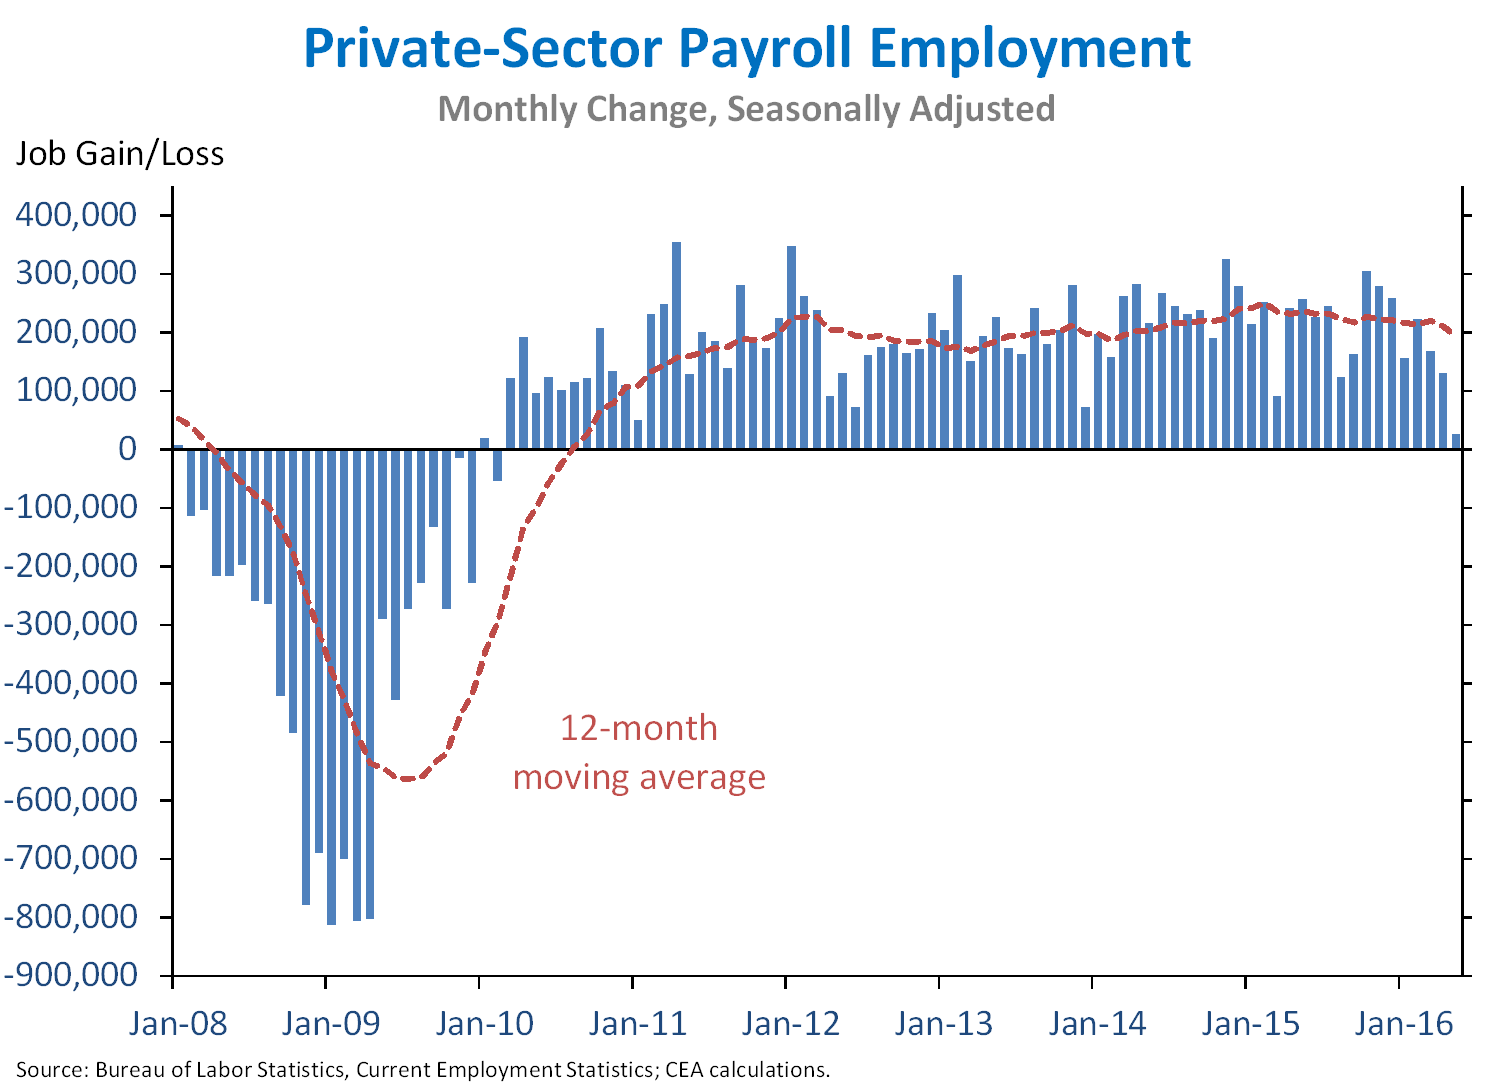
The economy added 38,000 jobs in May, considerably below both expectations and the pace of growth in recent months, with volatility in monthly data and a temporary strike in the telecommunications industry contributing to the disappointingly low number. U.S. businesses have now added 14.5 million jobs over 75 straight months of private-sector job growth. At the same time, the unemployment rate fell to 4.7 percent in May, its lowest level since November 2007. The labor force participation rate ticked down, though it remains at the same level as in June 2015. Importantly, average hourly earnings for private employees have increased 3.2 percent at an annual rate so far in 2016. In light of both volatility and temporary factors in monthly jobs data, it is important to view this month’s report in the context of both other recent data–including recent trends in consumer spending, vehicle and housing sales, and initial claims for Unemployment Insurance—as well as the longer-run trend in job growth. So far in 2016, payroll growth has averaged 150,000 jobs a month, well above the pace necessary to maintain a low and stable unemployment rate. This month’s report is a reminder of the important work that remains to sustain faster growth in jobs and wages, including investing in infrastructure and job training, implementing high-standards trade agreements like the Trans-Pacific Partnership, and raising the minimum wage.
FIVE KEY POINTS ON THE LABOR MARKET IN MAY 2016
1. U.S. businesses have now added 14.5 million jobs over 75 straight months, extending the longest streak on record. Today we learned that private employment rose by 25,000 jobs in May, with the temporary effects of a strike in the telecommunications industry (see point 2 below) being one factor among many that resulted in this disappointing figure, which was well below the pace of recent months. Total nonfarm employment rose by 38,000 jobs in May, also below the pace of recent months; nevertheless, the average pace of job gains so far in 2016 (150,000 jobs a month) remains well above the monthly pace necessary to maintain a low and stable unemployment rate given longstanding demographic trends affecting labor force participation.
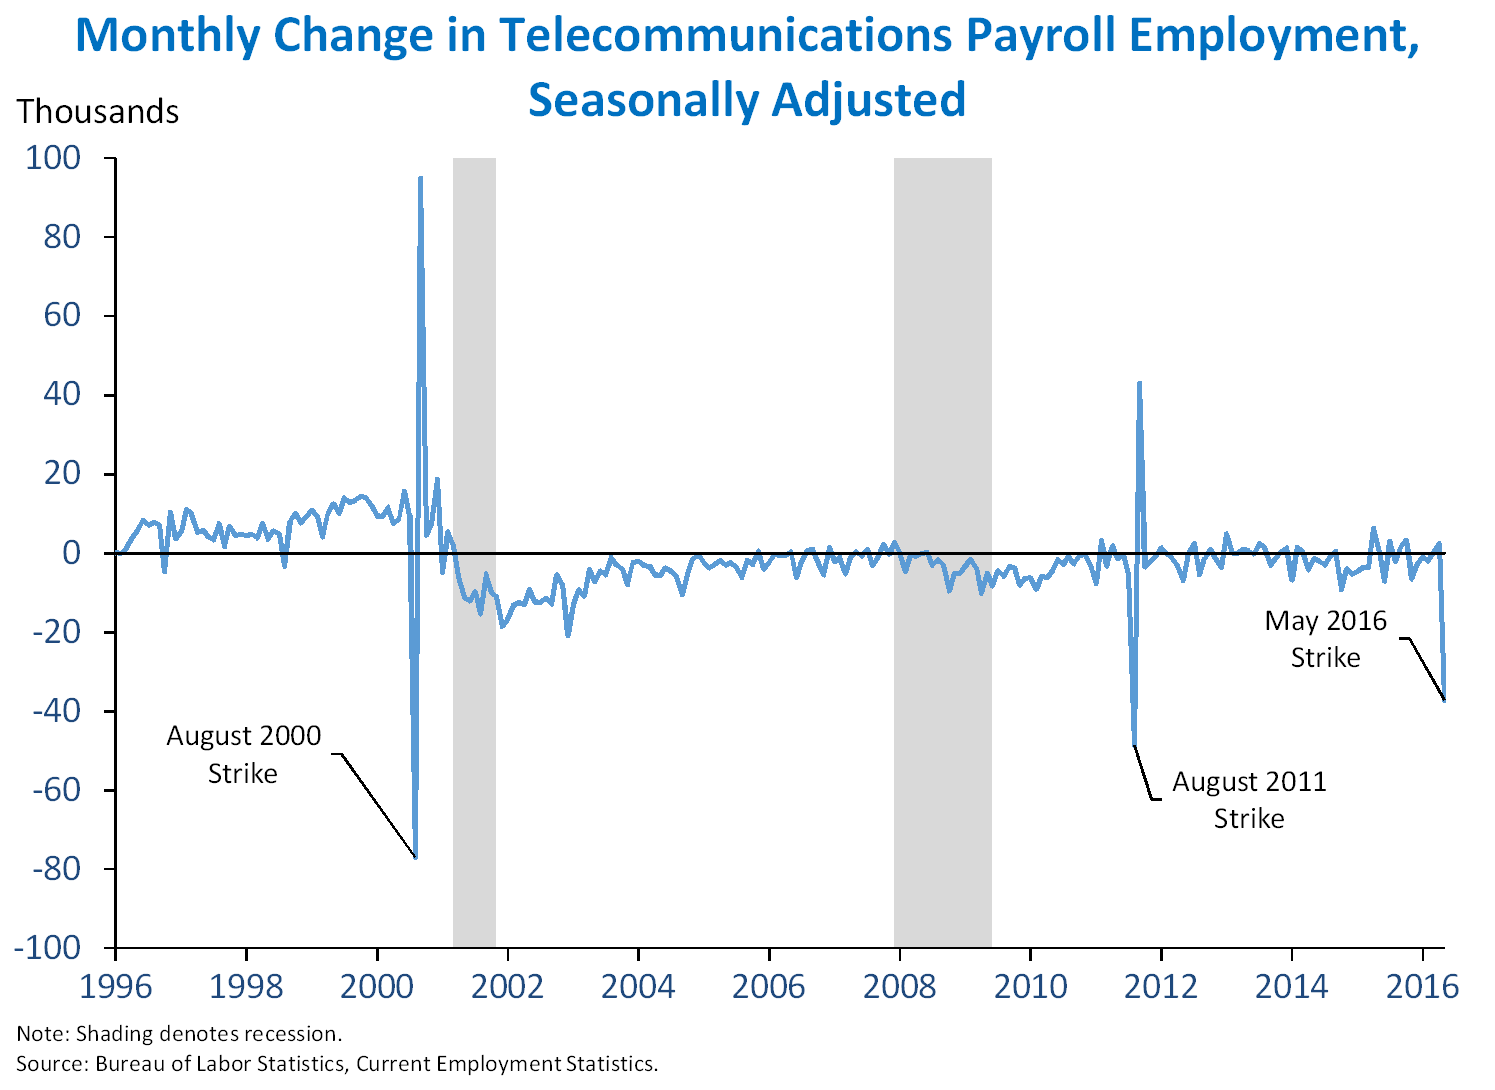
2. A portion of the slowdown in job growth in May was due to temporary effects of a strike in the telecommunications industry that are likely to reverse in June. Monthly job growth figures are derived from the establishment survey, which asks employers how many workers received pay during the survey’s reference pay period. As such, workers who are on strike during the survey’s reference period will not be counted as part of their establishment’s payrolls, creating an apparent drop in employment compared to the previous month. In May, BLS estimates that 35,100 workers in the telecommunications industry were on strike during the establishment survey reference period —the second-largest strike to occur during a reference period since 2004. The decline of 37,200 jobs in the telecommunications industry in May in part reflects the effects of this strike. In the past, strikes in this industry coinciding with the survey reference period had a noticeable negative effect on monthly estimates of changes in industry employment, as can be seen in the chart below. However, these downturns reversed once the strikes were resolved, leading to a jump in employment that almost perfectly offset the apparent job loss. Since telecommunications workers on strike in May 2016 returned to work on June 1 following a resolution of the strike, we may see such a reversal in next month’s report, putting upward pressure on overall payroll growth.
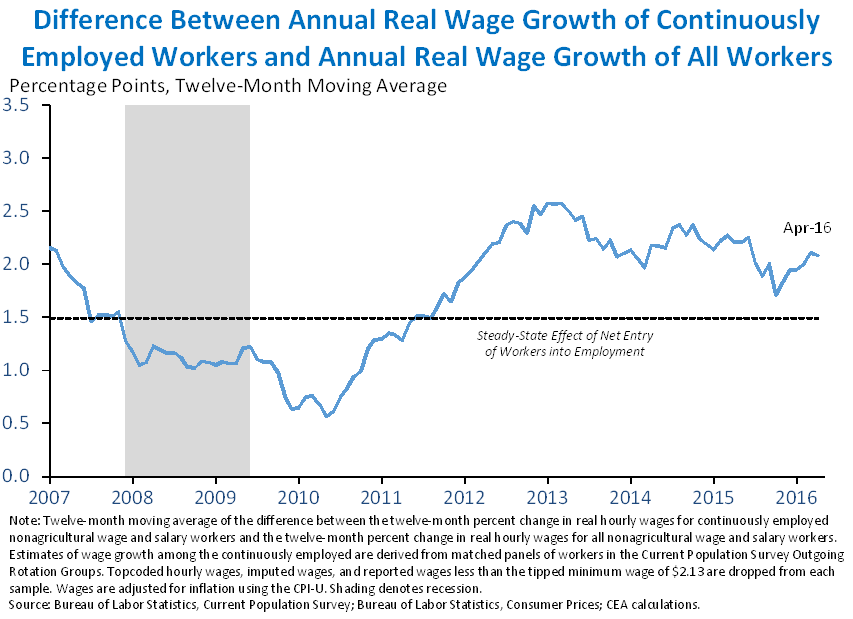
3. Actual wage growth for continuously employed workers is even higher than growth in reported average wages, which also include newer, lower-paid entrants to the workforce. In any given month, new entrants are usually paid less than both continuously employed workers and those exiting employment, in part because they typically tend to be younger and less experienced. In the recession, net entry of workers fell as more employees were laid off and fewer were hired. This had the perverse effect of boosting growth in reported average wages, since the overall composition of the employed workforce shifted towards higher-paid incumbent workers. For the last five years, the opposite has been the case: a strengthening economy has brought more lower-paid entrants into the employed labor force, which is a positive development even though it lowers reported average wage growth.
Nominal average hourly earnings for private-sector employees rose 2.5 percent over the past year, and have risen 3.2 percent at an annual rate so far in 2016. Since entrants are paid less than exiters on average and the workforce has been expanding at a solid pace in recent years, this factor means that wage growth trends may be somewhat stronger than they appear. CEA analysis suggests that even with typical net entry into employment (as a share of the labor force), annual real wage growth among the continuously employed would be roughly 1.5 percentage points higher than overall wage growth. In recent months, this difference has been about 2 percentage points, indicating that the net entry of individuals into the employed workforce is subtracting more from reported real wage growth than in the long-run steady state—the opposite of the case during the recession and the early phase of the recovery. However, this effect has declined somewhat since around 2013, and with the unemployment rate coming closer to its long-run value, this drag should continue to attenuate.
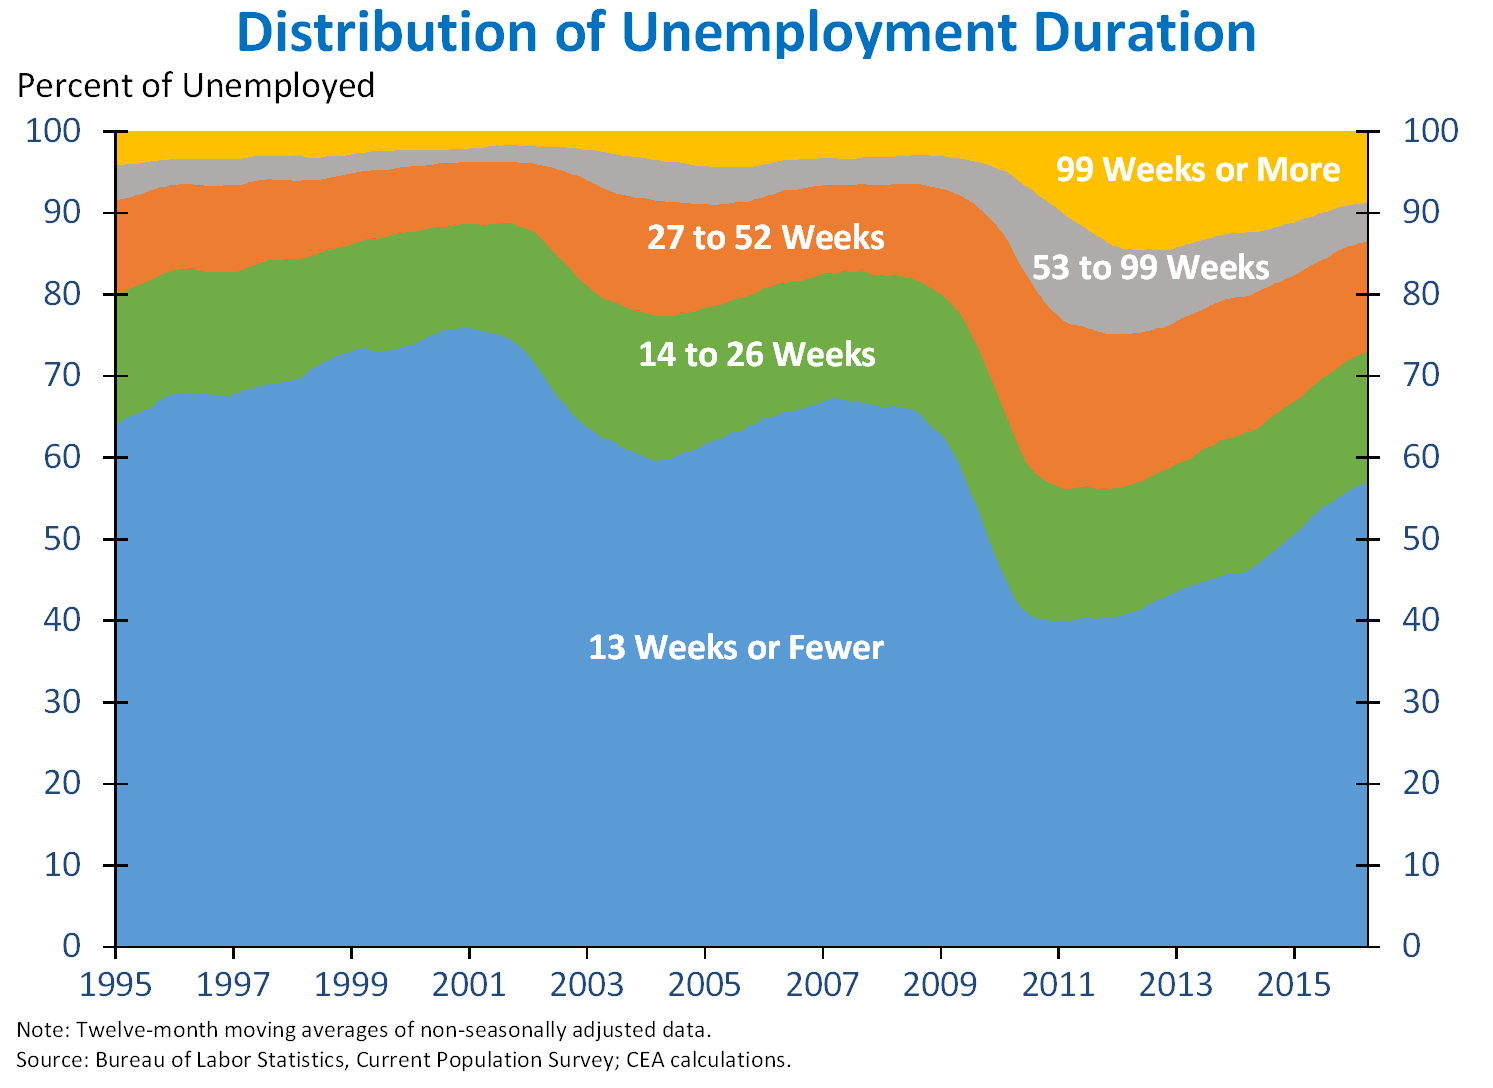
4. In May, the long-term unemployment rate—the share of the labor force out of work for 27 weeks or more and actively searching for a job—fell to 1.2 percent, its lowest level since August 2008, but both mean and median unemployment duration remain elevated. During the Great Recession, the long-term unemployment rate reached a record high of 4.4 percent in April 2010. At the same time, the distribution of unemployment duration shifted dramatically, with historically large increases in both the mean and median duration of unemployment. Both the mean and the median have decreased over the course of the recovery as the long-term unemployment rate has fallen faster than the overall unemployment rate: over the last year, falling long-term unemployment accounted for about half of the decline in the overall unemployment rate, even though the long-term unemployed currently make up only about one-quarter of unemployed workers.
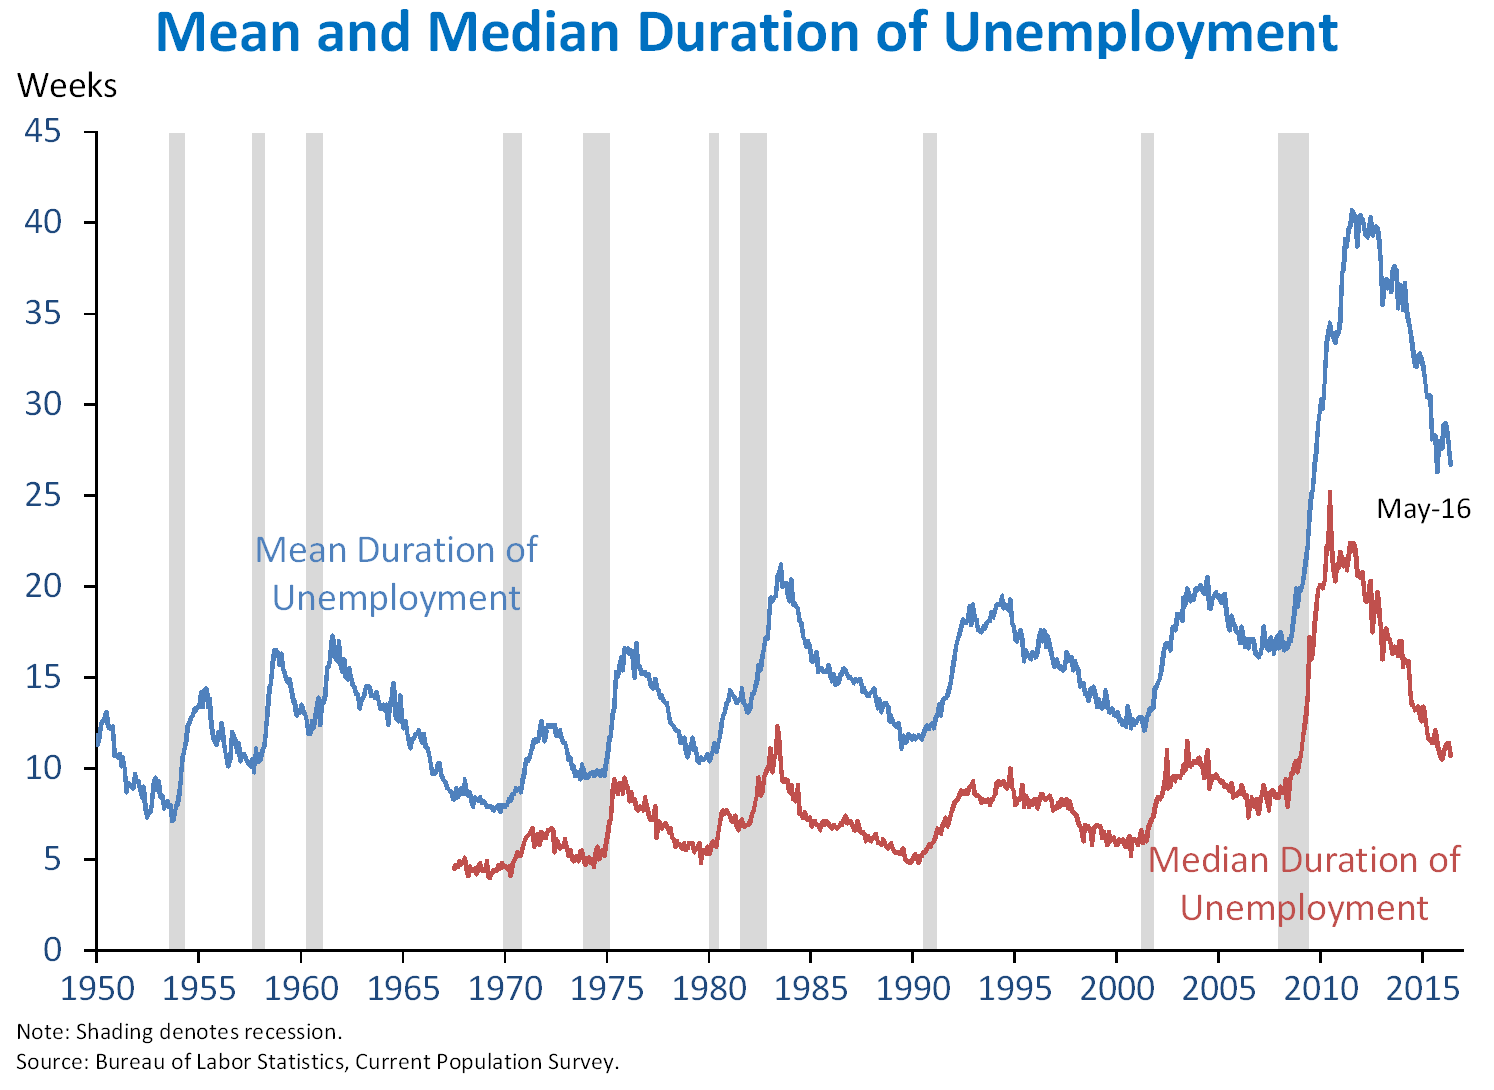
Nevertheless, the mean and median duration of unemployment are still elevated relative to their historical averages. Moreover, the gap between the two is also elevated, in part due to the relatively large remaining “tail” of individuals who have been out of work for periods much longer than 27 weeks. As can be seen in the chart below, the share of the unemployed who have been out of work for 99 weeks or more remains noticeably elevated relative to its historical trend. This remaining elevation is part of why President Obama has proposed a number of reforms to strengthen the Unemployment Insurance system, including providing wage insurance to protect against lost income and help unemployed workers transition more quickly back into employment.
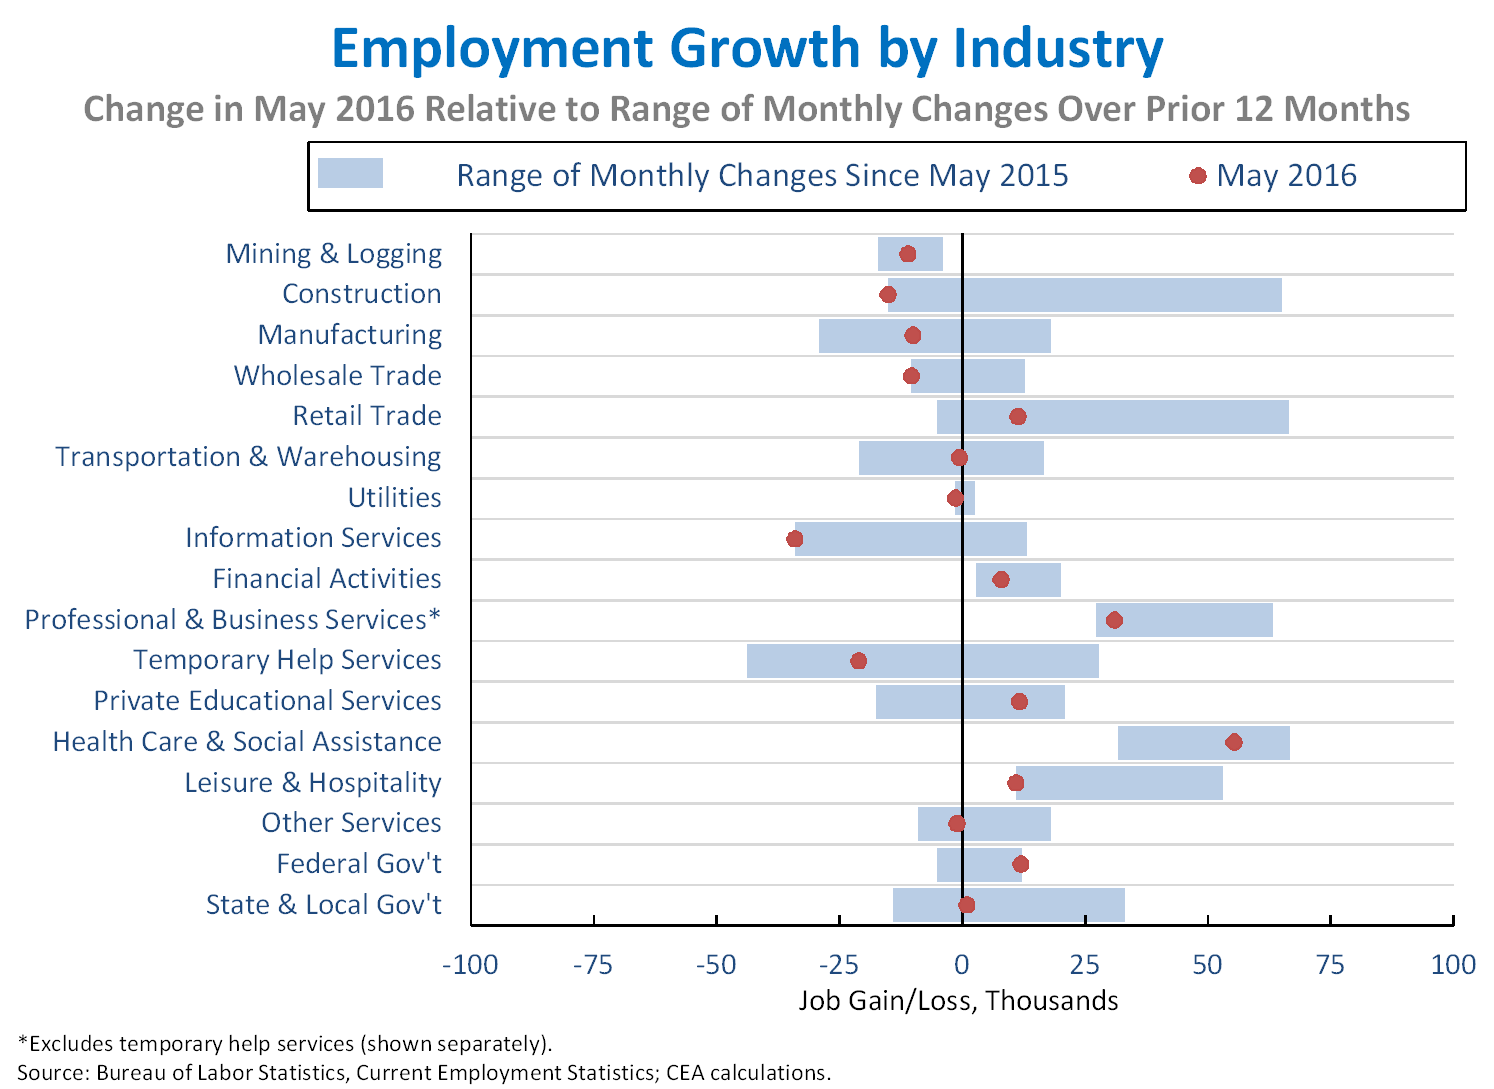
5. Job growth in a majority of industries fell below recent trends in May. Compared to the range of monthly changes over the past twelve months, May was an especially weak month for construction (-15,000), wholesale trade (-10,000), and utilities (-1,000). Information services saw a decline of 34,000 jobs, in part due to the strike in the telecommunications industry. Employment in manufacturing (-10,000) and mining and logging (-11,000)—which have seen cutbacks in recent months as a result of slow growth abroad and the decline in oil prices—both decreased in May. Across the 17 industries shown below, the correlation between the most recent one-month percent change and the average percent change over the last twelve months was 0.74, somewhat below the average correlation over the last year.
As the Administration stresses every month, the monthly employment and unemployment figures can be volatile, and payroll employment estimates can be subject to substantial revision. Therefore, it is important not to read too much into any one monthly report, and it is informative to consider each report in the context of other data as they become available.

