The Long-Term Budget Outlook
Today, I had the honor to speak before the Economic Club of Washington, D.C. on the economy and the President’s FY 2016 Budget. I made three key points that I believe should frame the budget debates going forward: (1) we have made both near-term and medium-to-long term fiscal progress; (2) the President’s FY16 Budget prioritizes both fiscal responsibility and economic growth; and, (3) we face a critical choice in whether we will return to austerity or continue the economic progress we’ve seen. I would like to dig into the first point a bit more here than I was able to do in my speech and explain the medium and long term fiscal progress we’ve made.
The President’s Budget provides official projections for spending, revenues, deficits, and debt over the next 10 years, reflecting the President’s proposed policies, including ending sequestration, investing in growth and opportunity, and reducing deficits and debt. But each year, the Budget also includes projections for the path of the Nation’s finances over the longer term. These long-term projections are highly uncertain, because they are driven by economic, demographic, and other predictions for the next 25 years. However, they can still provide valuable information about key fiscal trends. This year’s Analytical Perspectives chapter on the long-term budget outlook has three main findings.
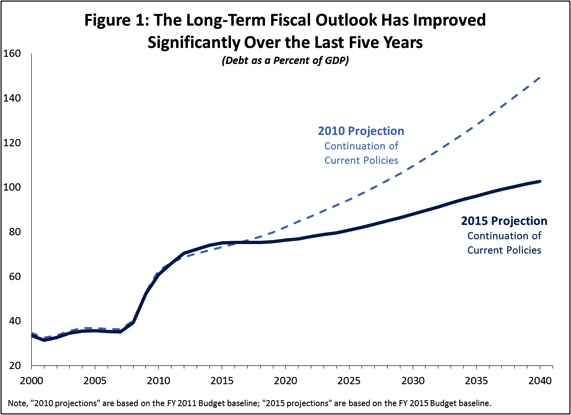
1. The medium-term and long-term budget outlook have improved substantially over the last five years. Since the President took office, deficits as a share of the economy have fallen by about two thirds. Less well known, but equally as important, projected deficits and debt have also fallen substantially.

Figure 1 shows projected debt as a share of GDP under a continuation of current policies – that is, without any of the deficit reduction measures proposed in the President’s Budget. As of February 2010, OMB’s current-policy forecast showed debt climbing to nearly 150 percent of GDP by 2040. Our 2015 projections still show an unsustainable fiscal outlook under current policies, with debt rising to about 100 percent of GDP. But they also show a very large improvement over the last five years. (Both the 2010 and the 2015 forecasts rely on projections by the independent Social Security and Medicare Actuaries for those programs.)
Another way to quantify the improvement is to look at the 25-year fiscal gap, a measure of the change in policy needed to stabilize debt as a share of the economy over a 25-year period. As of 2010, stabilizing debt for 25 years would have required average annual increases in revenues or cuts in non-interest spending equal to 2.4 percent of GDP, over $400 billion per year in today’s terms. Today, the change needed is 1.1 percent of GDP – less than half that amount.
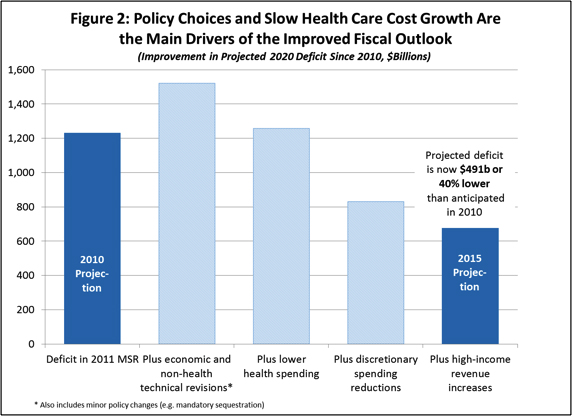
2. The improvement in the budget outlook is mostly the result of lower projected health spending, higher revenues, and reductions in discretionary spending. Since July 2010, OMB’s estimate of the 2020 deficit under current policies has come down by $491 billion, or about 40 percent. Figure 2 shows the key factors driving that improvement:

- Lower-than-expected Federal health spending. Revisions to health spending forecasts based on the historically slow growth of the past several years – and based on the assumption that only a portion of that slowdown will continue – have reduced projected health spending in 2020 by over $200 billion, compared to July 2010 projections. Counting associated interest savings, these improvements account for about half the net improvement in the projected deficit.
- Higher revenues. The American Taxpayer Relief Act (ATRA) of 2012 restored 1990s tax rates for the highest income 2 percent of Americans. That policy change will increase revenues by about $75 billion in 2020; counting associated interest costs, it accounts for about a fifth of the net improvement in projected deficits.
- Reductions in discretionary spending. Discretionary spending restraint has also played a substantial role in reducing projected deficits. The bulk of that improvement comes from the discretionary caps agreed to on a bipartisan basis in the Budget Control Act and from savings that has resulted from winding down wars in Iraq and Afghanistan. Sequestration accounts for a minority of the discretionary savings achieved since 2010 and has had a negative impact on critical services and pro-growth investments.
While it is difficult to precisely account for all the factors bringing down deficits beyond 2020, the major drivers behind the improvement are the same: lower projected health care costs, revenue increases from ATRA, and lower discretionary spending.
3. The deficit reduction measures proposed in the President’s Budget would have an even larger fiscal impact over the long run than over the next 10 years. Compared to continuing current policies as assumed in the estimates above, the President’s Budget achieves $1.8 trillion in deficit reduction over the next 10 years ($2.2 trillion counting additional savings from winding down wars). These savings come mostly from:
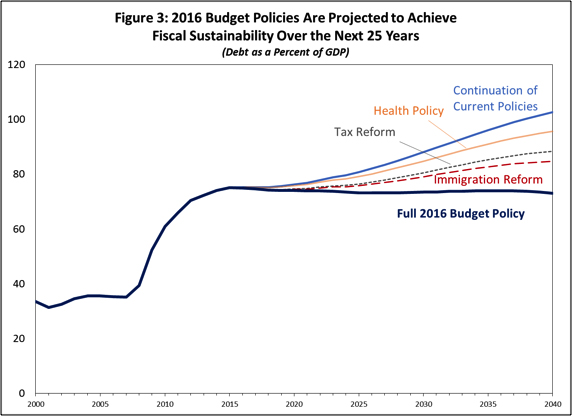
- Health reforms that will help sustain the recent slow-down in health care cost growth. The Budget includes more than $400 billion (2016-2025) in specified health savings that build on the Affordable Care Act and will help reduce health care costs while improving health care quality. The Budget’s health savings grow over time to about $1 trillion in the second decade and extend Medicare Hospital Insurance Trust Fund solvency by about five years. And to the extent these measures –along with the Administration’s other delivery system reform efforts – help sustain the recent slow-down in health care cost growth, the effects on the budget and the economy could be even more significant.
- Tax reforms that reduce inefficient high-income tax expenditures and close loopholes. The Budget raises about $640 billion (2016-2025) in net revenue for deficit reduction by curbing high-income tax expenditures, while also proposing additional revenue measures, such as capital gains tax reforms, to help pay for middle-class tax cuts and other investments. The savings from some of these proposals, especially the capital gains reforms, grow substantially over time meaning that the Budget’s tax proposals would make a larger contribution to deficit reduction in the second decade and beyond.
- Commonsense immigration reform. This year’s Budget again reflects the President’s support for commonsense, comprehensive immigration reform along the lines of the 2013 Senate-passed bill. In part because it helps balance out an aging population, immigration reform helps both the Budget – reducing deficits by $160 billion in the first decade and by an estimated $700 billion in the second decade – and the Social Security Trust Fund – closing about 8 percent of the Trust Fund shortfall and delaying reserve depletion by two years.
As shown in Figure 3, the Budget’s deficit reduction proposals are sufficient to stabilize and begin bringing down debt not just over the next 10 years but over the next 25, the period in which the fiscal impact of the Baby Boom Generation’s retirement will be fully felt.

These projections represent our current best estimates for the Federal budget. But as noted above, they are highly uncertain. The more complete Analytical Perspectives analysis shows how the projections could change for the worse if economic, demographic, or other conditions turned out to be less favorable than expected. Conversely, the projections could turn out to be too pessimistic – especially if the proposals in the President’s Budget are enacted and have their intended effects on investment, labor force participation, and productivity growth. The projections thus underscore the importance of coupling continued fiscal progress with fiscally responsible investments in accelerating growth, supporting work, and raising long-run productivity, as the President’s Budget proposes to do.
Shaun Donovan is Director of the Office of Management and Budget.
White House Blogs
- The White House Blog
- Middle Class Task Force
- Council of Economic Advisers
- Council on Environmental Quality
- Council on Women and Girls
- Office of Intergovernmental Affairs
- Office of Management and Budget
- Office of Public Engagement
- Office of Science & Tech Policy
- Office of Urban Affairs
- Open Government
- Faith and Neighborhood Partnerships
- Social Innovation and Civic Participation
- US Trade Representative
- Office National Drug Control Policy
categories
- AIDS Policy
- Alaska
- Blueprint for an America Built to Last
- Budget
- Civil Rights
- Defense
- Disabilities
- Economy
- Education
- Energy and Environment
- Equal Pay
- Ethics
- Faith Based
- Fiscal Responsibility
- Foreign Policy
- Grab Bag
- Health Care
- Homeland Security
- Immigration
- Innovation Fellows
- Inside the White House
- Middle Class Security
- Open Government
- Poverty
- Rural
- Seniors and Social Security
- Service
- Social Innovation
- State of the Union
- Taxes
- Technology
- Urban Policy
- Veterans
- Violence Prevention
- White House Internships
- Women
- Working Families
- Additional Issues

