The Employment Situation in May
The economy added 280,000 jobs in May—the strongest month of the year so far—as wages continued to rise and the participation rate ticked upward. We have now added 5.6 million jobs over the past two years, the best two-year job growth since 2000. Although the job market has made considerable progress throughout this recovery, challenges remain for our economy and there is more work to do. The President is committed to building on the positive trends through a comprehensive agenda to boost employment and wages for the middle class, including urging Congress to take important action such as opening new markets for U.S. goods and services through expanded trade, increasing investments in infrastructure, providing relief from the sequester, and raising the minimum wage.
FIVE KEY POINTS ON THE LABOR MARKET IN MAY 2015
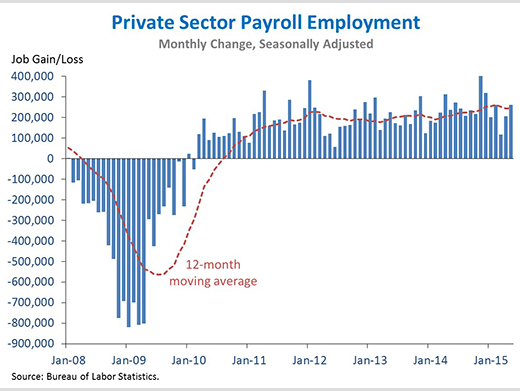
1. The private sector has added 12.6 million jobs over 63 straight months of job growth, extending the longest streak on record. Today we learned that private-sector employment rose by 262,000 in May. Our businesses created more than 200,000 jobs in fourteen of the past fifteen months—the first time that has happened since 1995. On the whole, our economy has added 3.1 million new jobs over the past twelve months, just off the fifteen-year high achieved in February.
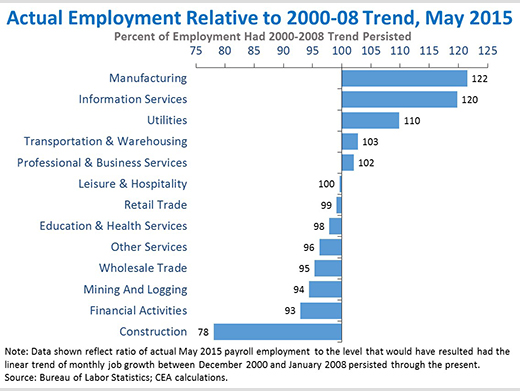
2. Manufacturing employment is up strongly as compared with the previous business cycle, while construction employment still has not recovered. In the manufacturing sector, employment trended down through the business cycle from 2000 to 2008. But manufacturing employment has rebounded since the financial crisis: today, there are 22 percent more manufacturing jobs than there would have been if the pre-existing pattern had persisted. A similar pattern is evident in the information services sector. Construction employment, however, has yet to return to pre-crisis levels and remains 22 percent below the trend over the previous business cycle. This is partly explained by an unsustainably high starting point for construction employment in January 2008, reflecting the state of the housing market at the time.
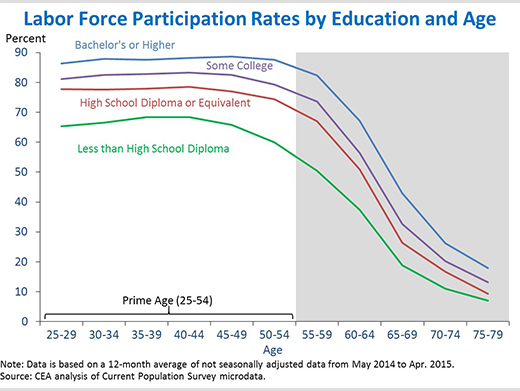
3. More highly educated Americans participate more in the labor force at all ages, and, compared with less educated workers, their participation does not drop off until much older ages. The overall labor force participation rate has been highly stable over the past thirteen months. However, there is important internal variation in participation, particularly with respect to education. For all ages over 25, labor force participation is unsurprisingly higher for more educated workers. Eighty-eight percent of prime age Americans (those aged 25 to 54) holding four-year college degrees participate in the labor force, compared with only 66 percent of Americans without a high school diploma or equivalent. Notably, the education-participation gap increases toward middle age as less-educated workers stop participating at younger ages. College graduates ages 50 to 54 participate at the same rate as those fifteen years their junior (88 percent), but for those without high school diplomas, the gap is 8 percentage points (60 percent for 50-54 year-olds versus 68 percent for 35-39 year-olds). It appears that not only do educated workers participate more, but they also participate longer. Indeed, encouraging access to higher education and making it more affordable promotes all three of the main drivers of middle-class incomes: participation, productivity, and equality.
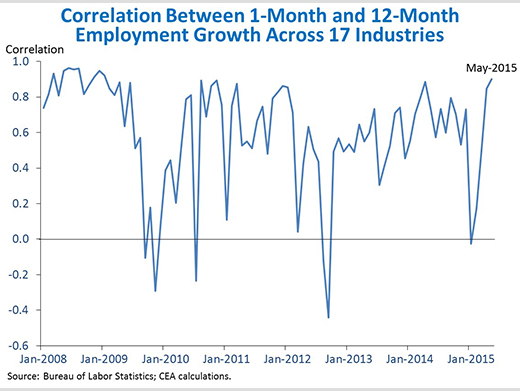
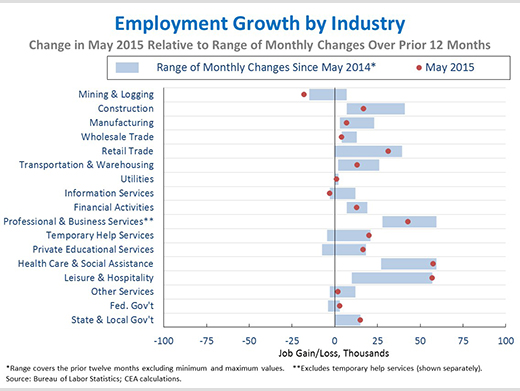
4. The distribution of job growth across industries in May was highly consistent with the pattern observed over the past year. One way to evaluate whether the composition of job growth is in line with recent trends is to consider the correlation between the most recent one-month percent change and the average percent change over the last 12 months across various industries. Looking across the 17 industries shown in the next point, the correlation between the May change and the average percent change over the last 12 months was 0.90, suggesting that the distribution of employment gains last month was very much in line with recent trends, albeit shifting up in most sectors, reflecting the stronger overall job growth in May. Indeed, this month saw the highest correlation of monthly and annual employment changes since January 2009. From 2008 on, this correlation has averaged 0.60. It therefore appears that employment growth in May generally followed the sectoral pattern of the last twelve months.
5. The majority of industries experienced stronger job growth in May than they have on average over the past year. Although the distribution of job growth generally followed recent patterns, in some cases it was a little above or below recent norms. May was an especially strong month for leisure and hospitality (+57,000), government (+18,000), health care and social assistance (+58,000), private educational services (+17,000), and temporary help services (+20,000). May was a weaker than usual month in mining and logging (-18,000), wholesale trade (+4,000), and information services (-3,000). In fact, May was the fifth consecutive month of declining mining and logging employment, likely reflecting cutbacks in oil production.
As the Administration stresses every month, the monthly employment and unemployment figures can be volatile, and payroll employment estimates can be subject to substantial revision. Therefore, it is important not to read too much into any one monthly report and it is informative to consider each report in the context of other data that are becoming available.
Jason Furman is the Chairman of the Council of Economic Advisers.
White House Blogs
- The White House Blog
- Middle Class Task Force
- Council of Economic Advisers
- Council on Environmental Quality
- Council on Women and Girls
- Office of Intergovernmental Affairs
- Office of Management and Budget
- Office of Public Engagement
- Office of Science & Tech Policy
- Office of Urban Affairs
- Open Government
- Faith and Neighborhood Partnerships
- Social Innovation and Civic Participation
- US Trade Representative
- Office National Drug Control Policy
categories
- AIDS Policy
- Alaska
- Blueprint for an America Built to Last
- Budget
- Civil Rights
- Defense
- Disabilities
- Economy
- Education
- Energy and Environment
- Equal Pay
- Ethics
- Faith Based
- Fiscal Responsibility
- Foreign Policy
- Grab Bag
- Health Care
- Homeland Security
- Immigration
- Innovation Fellows
- Inside the White House
- Middle Class Security
- Open Government
- Poverty
- Rural
- Seniors and Social Security
- Service
- Social Innovation
- State of the Union
- Taxes
- Technology
- Urban Policy
- Veterans
- Violence Prevention
- White House Internships
- Women
- Working Families
- Additional Issues

