The 2015 Economic Report of the President
This morning, the Council of Economic Advisers released the 69th-annual Economic Report of the President, which reviews the United States’ accelerating recovery and ways to further support middle-class families as the recovery continues. The economy is recovering from the Great Recession at an increasing pace, growing at an annual rate of 2.8 percent over the past two years, compared with 2.1 percent over the first three-and-a-half years of the recovery. The speed-up is especially clear in the labor market, where job gains have reached a pace not seen since the 1990s. But it is essential that a broad range of households benefit from the United States’ resurgent growth, so this year’s Report focuses on factors that are important to middle-class incomes: productivity, labor force participation, and income inequality. The President’s approach to economic policies, what he calls “middle-class economics,” aims to improve each of these long-standing elements and ensure that Americans of all income levels share in the accelerating recovery.
Below are some highlights from each of the seven chapters in this year’s Report:
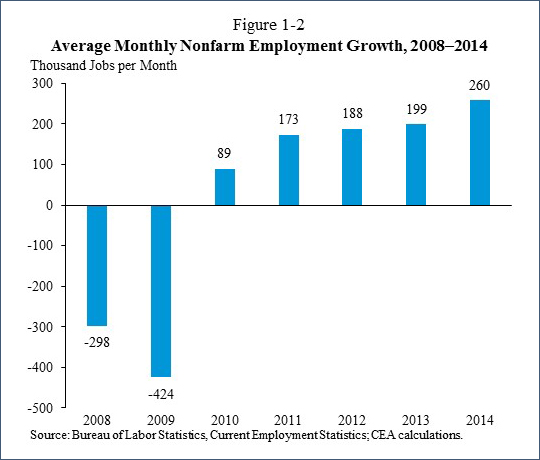
Chapter 1 reviews the progress of the recovery and explores the long-term factors that drive middle-class incomes. The U.S. recovery has accelerated in terms of both output and employment, with job growth rising 30 percent faster in 2014 than in 2013 (Figure 1-2). Indeed, the unemployment rate has fallen to levels that, as recently as 2013, were not expected until after 2017. These labor market improvements have begun to translate into wage gains for middle-class workers, but nevertheless, this recent progress cannot make up for decades of sub-par middle-class income growth. The chapter provides historical and international context for middle-class income growth and the three key factors that influence it: productivity growth, changes in labor force participation, and income inequality. The increasing strength of our current recovery provides an opportunity to address these long-standing challenges, and the President supports a wide range of policies, detailed in this Report, that will strengthen all three key factors.
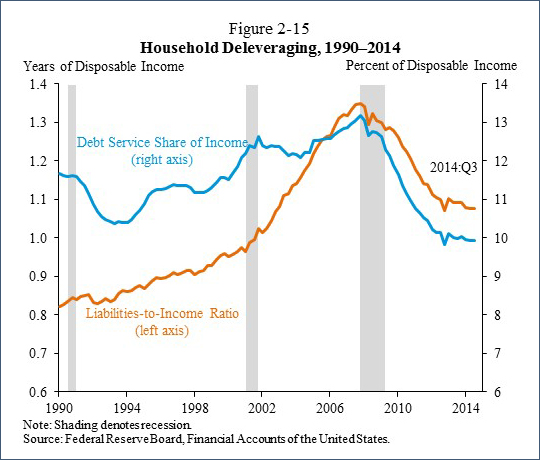
Chapter 2 reviews the macroeconomic performance of the U.S. economy during 2014, including the growth of output and employment, the continued decline in the unemployment rate, the healing of the housing market, and the improvement in the budget deficit as a share of GDP. By most measures, the pace of output growth has risen relative to the beginning of the recovery. Gross domestic product grew 0.7 percentage point faster per year over 2013 and 2014 than over the first three-and-one-half years of the recovery. Meanwhile, U.S. households continued to pay down their debts. Figure 2-15 shows the dramatic rise in the household sector’s liabilities-to-income and debt-service ratios in the run-up to the financial crisis, along with the reduction in these ratios that followed. By the third quarter of 2014, required payments on mortgage and consumer debt had fallen to 9.9 percent of disposable income, nearly the lowest level on record. The chapter explores this and other macroeconomic developments, including the slowdown in global growth, which could pose some downside risk to U.S. economic growth in the future. The chapter also reviews the assumptions about future growth that underlie the President’s Fiscal Year 2016 Budget, including the economic benefits of the President’s agenda. The chapter explores the benefits of immigration reform, infrastructure investment, and business tax reform, among other pro-growth policies that the President supports.
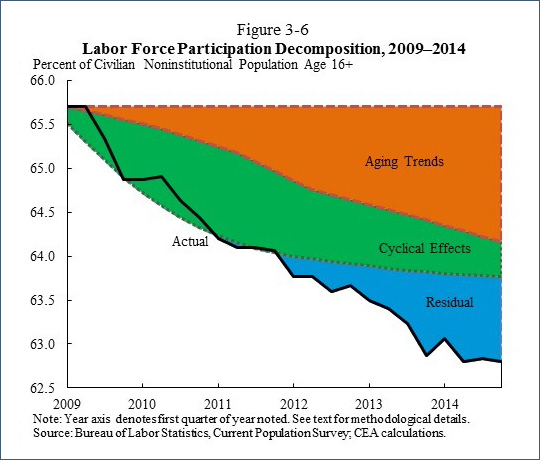
Chapter 3 addresses the opportunities and challenges facing the U.S. labor market. The sharp drop in unemployment in 2014 came amid a stabilization in the labor force participation rate and the strongest annual job growth since the 1990s as businesses added more than 3 million jobs. But economic performance must be gauged by more than just the unemployment rate — a successful job market also encourages labor force participation, supports quality jobs, and facilitates effective job matching of workers and positions. This chapter reviews the United States’ recent labor market progress and discusses five long-standing labor market challenges that motivate many of President Obama’s policy initiatives. The decline in the labor force participation rate earlier in this recovery is one such important challenge. Just over half the participation decline has been driven by an aging population as the “baby boomer” generation has begun to retire (Figure 3-6). Moreover, labor force participation has stabilized over the past year, indicating that the 2014 unemployment decline reflected strong job growth rather than a shrinking labor force.
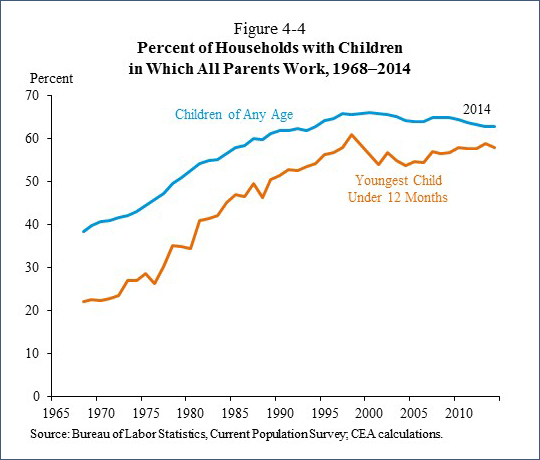
Chapter 4 discusses how American family lives have changed over the last half-century and the implications of these changes for our labor market. Women now represent almost one-half of the workforce, married couples increasingly share child-care responsibilities, and people live — and work — longer than in the past. Today, all parents are working in more than 6 out of every 10 households with children, up from 4 out of 10 in 1968 (Figure 4-4). Chapter 4 considers some of the crucial changes that are needed to help Americans better balance their work and caregiving responsibilities. While many workers have limited access to family-friendly workplace policies such as paid sick and family leave, recent state and local policies have expanded access to these benefits. The chapter examines workplace flexibility policies — a range of policies that enable workers to adjust aspects of work as needed. It also discusses the economic evidence for paid leave and workplace flexibility policies that the President has proposed, showing how these policies can increase worker productivity, retention, and morale. This evidence demonstrates that family-friendly policies can benefit workers, businesses, and the economy.
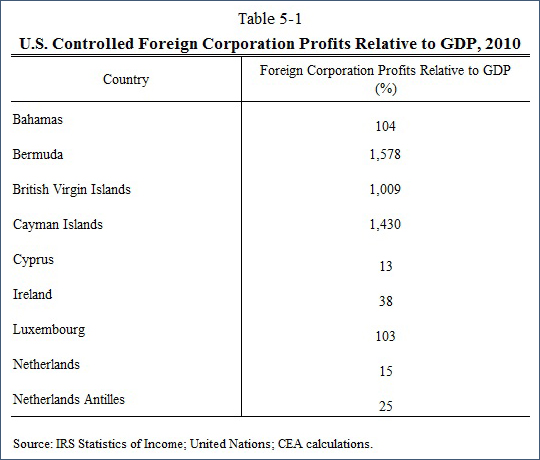
Chapter 5 shifts the focus to productivity growth with an examination of business tax reform as well as a briefer discussion about the complementary issues in individual taxation. In 2014, the top statutory corporate tax rate in the United States was roughly 10 percentage points above the OECD average. At the same time, the U.S. tax code is riddled with loopholes that benefit certain companies without justification. For example, the tax code gives U.S. corporations the ability to reduce dramatically their tax bills by locating subsidiaries in small, low-tax countries. This pattern is evident in the outsized amounts of foreign corporate profits reported in many of these countries (Table 5-1). The President’s approach would close loopholes in the tax code while making it more attractive for companies to locate and invest in the United States. The chapter describes this and other components of the President’s approach to reform, documenting four channels through which reform can boost productivity and living standards: encouraging domestic investment, improving the quality of investment, reducing the inefficiencies of the international tax system, and facilitating investments in infrastructure.
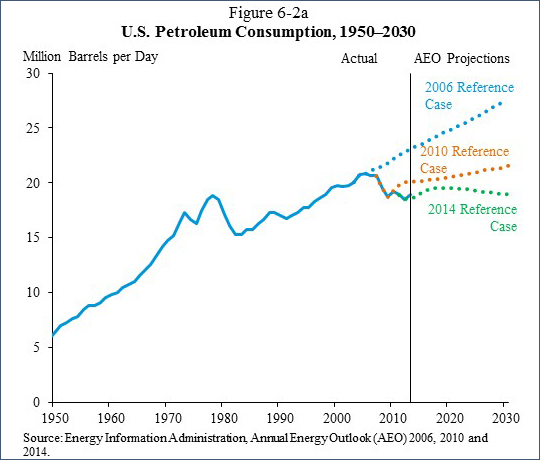
Chapter 6 reviews the profound transformation of the U.S. energy sector. The United States is producing more oil and natural gas and generating more electricity from renewables such as wind and solar. While the dramatic increase in U.S. oil production in widely recognized (Figure 6-3), a less well known but also critical trend is the decrease in U.S. oil consumption (Figure 6-2a), which reflects rising fuel efficiency among other factors. To build on this progress, to foster economic growth, and to ensure a sustainable low-carbon economy for future generations, the President has set out an aggressive all-of-the-above energy strategy. This chapter lays out the key elements of the strategy that will enhance U.S. energy security and limit greenhouse gas emissions in ways that also support economic growth and job creation. In recent years, expanded production of oil, natural gas, and renewables has raised employment in those industries during a period of labor-market slack. At the same time, technological innovation and greater production have helped to reduce energy prices, to the benefit of energy-consuming businesses and households. These developments have contributed broadly to employment and GDP growth, and will continue to do so.

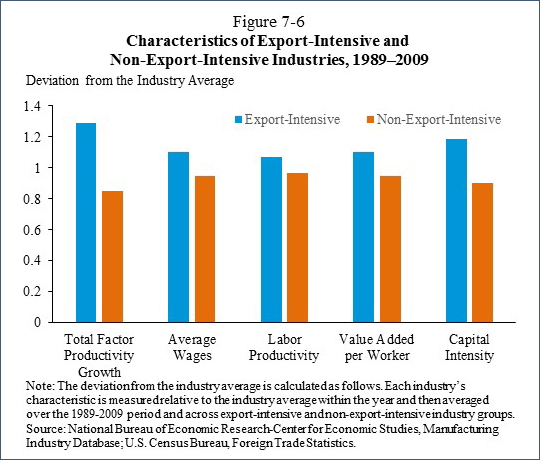
Finally, Chapter 7 situates the United States in the context of the global economy. The United States is more integrated with the rest of the world than ever before. This chapter examines the substantial potential benefits of greater U.S. integration with the global economy, through both international trade in goods and services and financial transactions in international capital markets. It presents empirical evidence on the economic effects of enhanced U.S. trade and free trade agreements, as well as on ongoing trends such as the nation’s growing surplus in services trade. U.S. businesses that expand in response to the increased foreign market access provided by U.S. free trade agreements support American jobs, strengthening the middle class in several ways. As Figure 7-6 shows, on average over the 1990s and 2000s, export-intensive industries report 17 percent higher average wages than non-export-intensive industries, similar to what has been found in other studies. Exporting industries also tend to be more productive and to rely more on capital and skilled workers. In addition to bringing down our trading partners’ tariff and non-tariff barriers closer to the low levels the United States already has, President Obama’s “values-driven” trade policy seeks to do what’s best for the American middle class by enforcing international trade agreements that improve labor and environmental standards around the world, combat corruption, and strengthen the rule of law abroad. These agreements therefore allow American firms and American workers to compete on a level playing field in the global economy.
Jason Furman is the Chairman of the Council of Economic Advisers. Maurice Obstfeld and Betsey Stevenson are members of the Council.
White House Blogs
- The White House Blog
- Middle Class Task Force
- Council of Economic Advisers
- Council on Environmental Quality
- Council on Women and Girls
- Office of Intergovernmental Affairs
- Office of Management and Budget
- Office of Public Engagement
- Office of Science & Tech Policy
- Office of Urban Affairs
- Open Government
- Faith and Neighborhood Partnerships
- Social Innovation and Civic Participation
- US Trade Representative
- Office National Drug Control Policy
categories
- AIDS Policy
- Alaska
- Blueprint for an America Built to Last
- Budget
- Civil Rights
- Defense
- Disabilities
- Economy
- Education
- Energy and Environment
- Equal Pay
- Ethics
- Faith Based
- Fiscal Responsibility
- Foreign Policy
- Grab Bag
- Health Care
- Homeland Security
- Immigration
- Innovation Fellows
- Inside the White House
- Middle Class Security
- Open Government
- Poverty
- Rural
- Seniors and Social Security
- Service
- Social Innovation
- State of the Union
- Taxes
- Technology
- Urban Policy
- Veterans
- Violence Prevention
- White House Internships
- Women
- Working Families
- Additional Issues

