
Today’s data on national health expenditures show that 2014 was another year of slow health care cost growth, as per-enrollee health care spending growth remained low in both the public and private sectors. The slow growth in the per-enrollee spending seen in recent years is thanks in part to reforms in the Affordable Care Act and is generating major fiscal and economic benefits. Alongside continued slow growth in per-enrollee spending, today’s release corroborates earlier data showing that aggregate health care spending growth increased in 2014, largely because millions of people gaining coverage under the Affordable Care Act began to access care. Faster aggregate spending growth due to expanding coverage is neither a surprise, nor a cause for concern, and will fade as coverage stabilizes at its new, higher level over the coming years. Looking ahead, other data show that slow growth in per-enrollee spending has continued during 2015, alongside further progress in expanding health insurance coverage. But extending this progress into 2016 and beyond will require making full use of the tools provided by the Affordable Care Act to continue building a health care system that provides broad access to efficient, high-quality care.
FIVE KEY POINTS ON TODAY’S NATIONAL HEALTH EXPENDITURE DATA
1. Per-enrollee health care spending growth remained low in both the public and private sectors during 2014. Both private insurance and Medicare saw continued slow growth in real per-enrollee spending during 2014*. Although modestly faster than the average rate from 2010 to 2013, the growth rates recorded in 2014 were less than one-third those seen over the preceding decade and below the growth rate of per capita GDP. Prior to 2010, lower annual growth in real per-enrollee spending had been recorded only once for private insurance and just twice for Medicare since these data series began in 1988. Per-enrollee spending trends are a particularly important measure of health care costs trends because the premiums and cost sharing amounts faced by individuals and families depend directly on the per-enrollee cost of care. 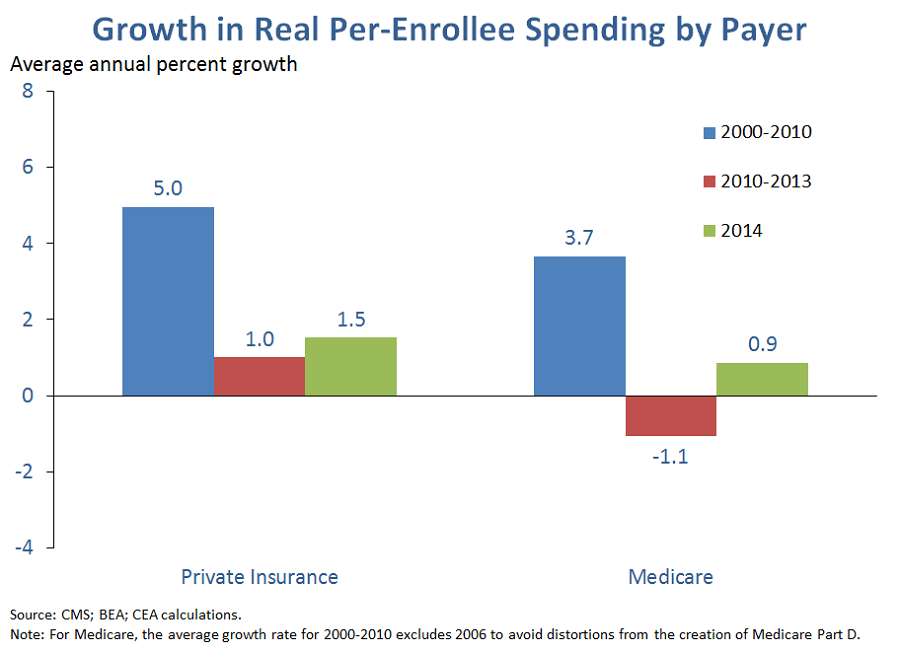
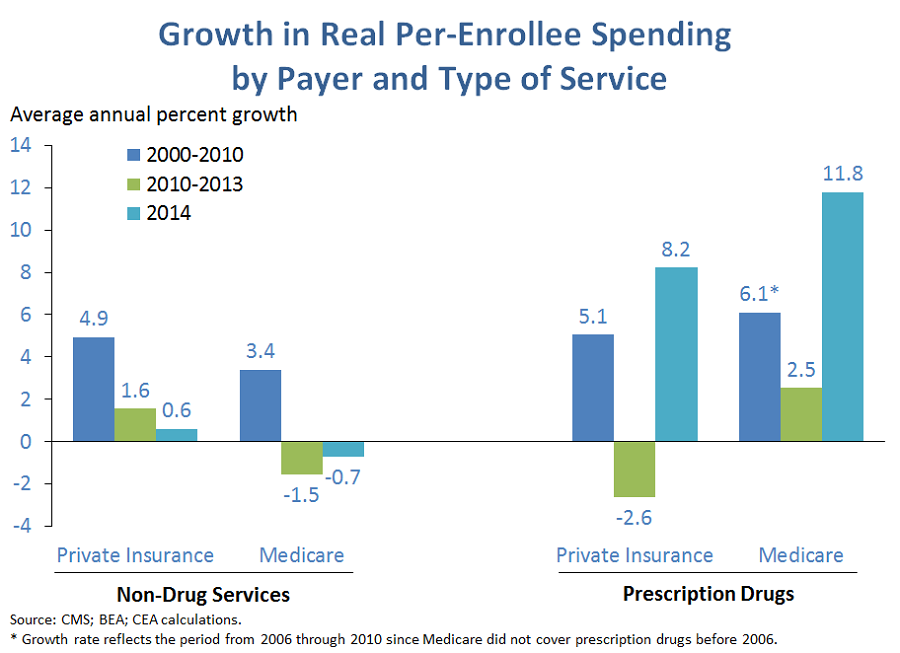
2. Growth in per-enrollee spending for services other than drugs was roughly in line with recent experience in 2014, while drug spending accelerated sharply. For health care services other than drugs, per-enrollee spending growth in 2014 was generally similar to the 2010-2013 period, with growth picking up modestly in Medicare and slowly modestly in private insurance. By contrast, growth in per-enrollee drug spending was sharply higher in both private insurance and Medicare, with real per-enrollee drug spending growth rising into the high single digits in private insurance and reaching double digits in Medicare. Available data indicate that the main factor driving faster drug spending has been the arrival of costly, though often effective, new therapies. While drug spending growth may not persist at its recent rapid pace in the years ahead, trends in this area have raised concerns about access and affordability in both the public and private sectors.
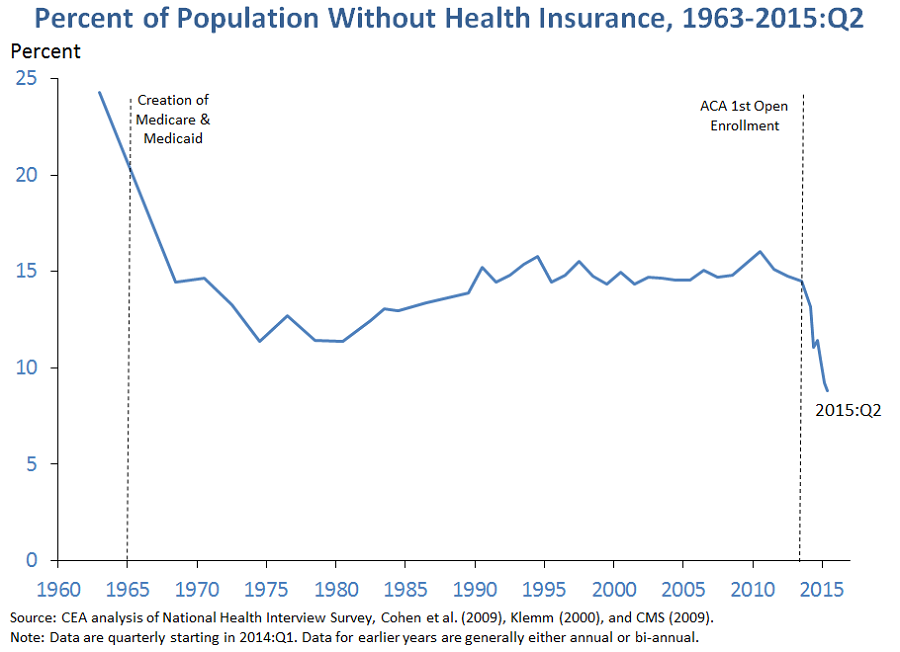
3. Aggregate health care spending growth increased in 2014, driven by a historic expansion of insurance coverage. Today’s release shows that aggregate health care spending grew 3.6 percent in 2014, faster than the historically slow growth over the last few years. The fact that per-enrollee spending growth increased only modestly in 2014 implies that the main driver of this pickup in aggregate spending growth was the historic expansion in insurance coverage under the Affordable Care Act, which increased utilization of health care services by the newly insured.
Indeed, a pair of recent analyses have estimated that coverage gains due to the Affordable Care Act added at least 1.4 percentage points to growth in aggregate health care spending during 2014. That implies that real aggregate national health expenditures would have grown just 2.2 percent in 2014 absent the coverage expansion, only slightly above the 1.6 percent average annual rate seen from 2010 to 2013. Had real aggregate national health expenditures grown at this rate in 2014, then 2014 growth would have been the fourth lowest on record, after only 2011, 2012, and 2013.
As we have noted previously, it is neither a surprise, nor a cause for concern to see aggregate health care spending temporarily grow more quickly while coverage is transitioning to its new, higher level. One important goal of expanding coverage is to improve access to care for the newly insured, and faster aggregate spending growth is an important indication that access to care is, in fact, improving. In addition, as noted above, what matters for people who had coverage before is growth in per-enrollee spending, which remains quite low, not growth in aggregate spending.
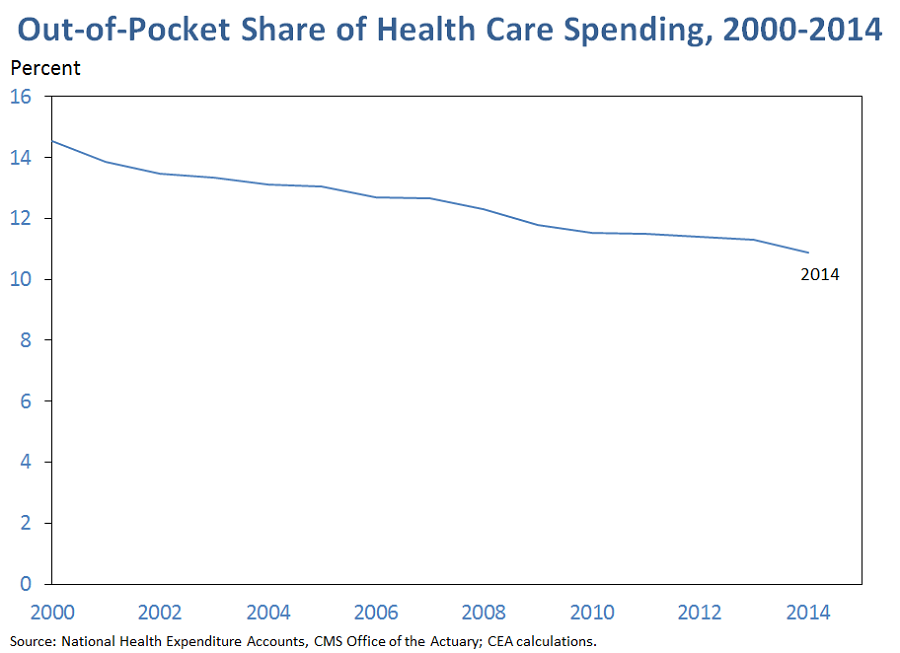
4. Out-of-pocket spending reached a historic low as a share of total health care spending in 2014, likely thanks at least in part to expanding coverage. The share of national health expenditures financed by individuals’ out-of-pocket payments fell to 10.9 percent in 2014, the smallest share since these data began in 1960. The expansion in insurance coverage during 2014 likely played an important role in this decline since the newly insured were previously paying out of pocket for all of their care, but now only pay out of pocket for the portion of their care not covered by their health insurance.
As also shown in the graph, the share of health care spending borne by consumers in the form of out-of-pocket costs has been falling steadily in recent years. One implication of this fact is that focusing on the steady rise in deductibles in employer coverage since the early 2000s—which suggests that out-of-pocket costs have grown faster than health care spending as a whole—paints a misleading picture of the overall trend in out-of-pocket cost burdens. This is likely the case for a variety of reasons. Even within employer coverage, the trend in deductibles does not appear to be representative of the overall trend in cost sharing, which also depends on other aspects of plan design; for example, the share of individuals with an annual out-of-pocket limit above which no cost-sharing applies has risen sharply in recent years. Focusing solely on employer coverage also misses trends in other types of coverage (or shifts in the composition of coverage), which may also have affected the economy-wide trend in the out-of-pocket share in recent years.
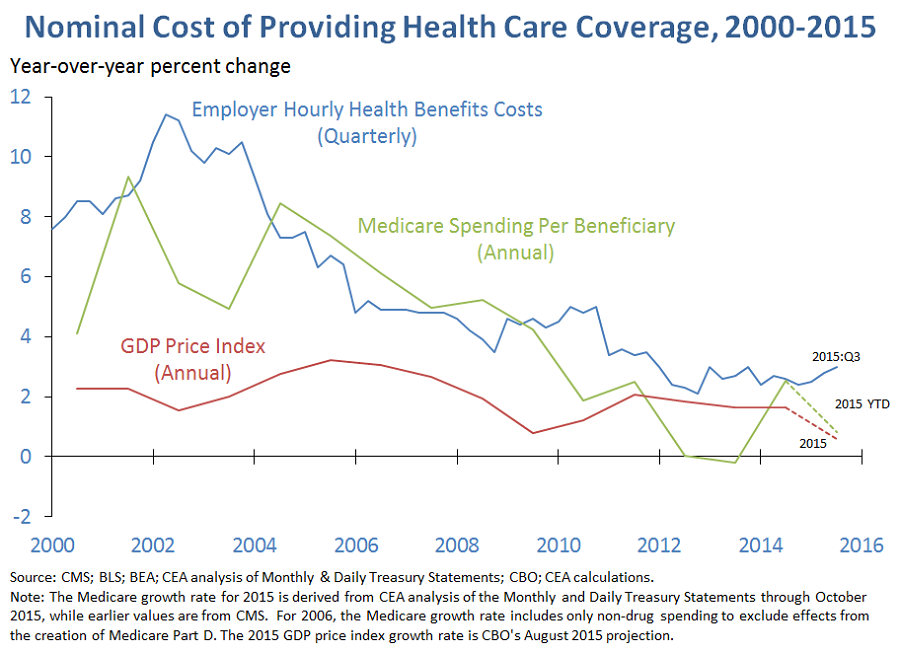
5. Other data show that per-enrollee health care spending growth has remained low well into 2015. Data from the Bureau of Labor Statistics’ Employment Cost Index show that employers’ hourly health benefit costs are up just 3.0 percent over the four quarters ending in 2015:Q3, only slightly higher than the 2.6 percent growth recorded over the preceding four quarters. In Medicare, CEA analysis of preliminary data from the Monthly and Daily Treasury Statements implies that nominal Medicare spending per beneficiary in the first ten months of 2015 was roughly 1 percent higher than in the corresponding ten months of 2014, below the 2.4 percent growth rate recorded for 2014. It therefore appears likely that 2015, like 2014, will be another year that pairs slow growth in per-enrollee costs with rapid gains in insurance coverage.
Jason Furman is the Chairman of the White House Council of Economic Advisers. Matt Fiedler is Chief Economist for the White House Council of Economic Advisers.
*Medicaid spending per enrollee, which is not shown, fell in 2014. However, this decline was driven in part by an influx of younger, healthier enrollees as States expanded their Medicaid programs under the Affordable Care Act. It is therefore likely not a reliable guide to underlying cost trends. By contrast, trends in per-enrollee spending in private insurance and Medicare were likely little affected by the coverage expansion.


